Barely a day goes by these days it seems without one of two things being announced in the early morning financial press – either another hundreds of billions of dollars of data centre spending to support AI, or another all-time high for the US stock market. On a bumper day we may get both. With simply these headlines as data points we might conclude that it is boom time in the global economy. The picture on the ground is, though, mixed at best, and to be fair to financial reporters this does get coverage too. Outside of data centres the rest of the economy is struggling for traction in the US, and similar can be said for the European economy aside from early signs of promised increases in governmental defence spending translating into orders.
We see this in our analysis of companies and the equity market. Revenue growth for the market overall is stagnant in euro terms over the last yeari, with a notable exception being the IT sector, though at a rate that is below what might be expected given prevailing market narratives and valuations. As we mentioned in last month’s missiveii, the Consumer Goods sector has experienced a slowdown as the impact of higher prices and tighter financing seem to have eventually taken their toll post-pandemic. This is despite the positive wealth effect in the US driven by substantial investments in the US stock market for the top earners, who increasingly account for most of overall personal consumption, and consumption growthiii.
Given the roaring market momentum, it is perhaps surprising that revenue growth is stagnant, but it makes sense when comparing to the real economy. In the US in the first half of 2025 tech hardware and software investment contributed more to GDP growth than personal consumption expenditures and, excluding datacentre-related spending, fixed private investment was downiv. Earnings growth has been stagnant outside of the ‘Magnificent Seven’ large technology companies and, pandemics aside, unemployment is rising for the first time since the Great Financial Crisis (particularly for recent graduates) while job creation is weak. And despite the President claiming to the UN that “inflation has been defeated,” CPI is lingering above target at around 3%. That’s while most of the tariff costs are being swallowed by US businesses, for now, rather than being passed onto consumers, a situation that may not persist. Additionally, electricity prices are surging due to demand from data centres, the continuation of which would put upward pressure on inflationv.
Yet despite all of this, equity markets are at highs. There’s nothing wrong with the market notching up ever more record results if they are backed by profits and cash flow, but this doesn’t seem to be the case. We couched an analysis of the US market in profit terms earlier in the yearvi. Another way of looking at the relationship between price and underlying value is to examine free cash flow. Free cash flow is to a company what discretionary income is to you and us. This is, broadly speaking, the cash that a company generates in a year from its operations, less what it has spent on long-lived assets like plant, buildings and, in some cases, intellectual property. Free cash flow is something of an Evenlode obsession at the corporate level and we can aggregate a figure for the portfolios we manage and for the broader market. By dividing that number by a company’s (or market’s) market value, we get the free cash flow yield, which is the amount of free cash flow you get as an owner as a proportion of what you pay to own it. The chart below shows how the free cash flow yield has evolved over the last three years for the IFSL Evenlode Global Income portfolio and for the MSCI World Index:
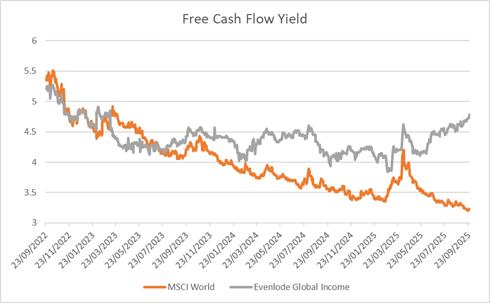
All other things equal, a higher free cash flow yield indicates a more attractively valued company, portfolio or market as it indicates you’re getting more cash generated by the company per share invested as a shareholder. What has happened to the market over the last three years is a clear and consistent decline, albeit with a prominent bump early this year in the post-Trump-tariff market sell-off. The decline has happened because whilst free cash flow at the market level has tracked sideways over the last few yearsvii, the market has increased in value substantially. In contrast, the IFSL Evenlode Global Income portfolio has gone the other way, with increasing free cash flowviii but a little changed market value.
So, we see that despite the buoyant headline equity market index levels, not all companies are being treated by the market as if they’re in boom time even if they continue to grow. Perhaps there is an underlying economic pessimism being reflected when one scratches below the surface of the market. Or maybe technical factors are at play, such as momentum-driven market inflows encouraging a cycle of inelasticityix, indiscriminate capital allocation from passive investors/index trackers and ‘active’ funds alike, and record levels of foreign investment in the largest companies (even by risk-averse central banks like the Swiss). Whatever the reason, for us at Evenlode what’s striking is that our portfolio companies continue to generate superior growth and returns on capital than the market, but at ever-better valuations.
This is creating an unusual opportunity, where growth, quality and value can all be easily achieved in a portfolio. Easily, that is, in purely analytical terms; what’s more difficult is having the discipline and patience to persist with such a portfolio when all of the market action is elsewhere. Previously returns from the portfolio traded blows with the index. Now they’ve become detached, anchored to the floor while the market soars to stretched valuations by many metrics, driven largely by big tech and cyclical sectors. We have confidence that economic gravity will ultimately exert itself on the market, and positive corporate results will translate to positive market returns for companies that have been left behind. What we don’t know is when this will happen, but things that can’t go on forever have a tendency not to. This is where the application of a disciplined, actively managed investment process becomes particularly important.
Ben Peters and Rob Strachan
30 September 2025
Evenlode has developed a Glossary to assist investors to better understand commonly used terms.
Please note, these views represent the opinions of the Evenlode Team as of 30 September 2025 and do not constitute investment advice. Where opinions are expressed, they are based on current market conditions, they may differ from those of other investment professionals and are subject to change without notice. This document is not intended as a recommendation to invest in any particular asset class, security, or strategy. The information provided is for illustrative purposes only and should not be relied upon as a recommendation to buy or sell securities. For full information on fund risks and costs and charges, please refer to the Key Investor Information Documents, Annual & Interim Reports and the Prospectus, which are available on the Evenlode investment Management website (https://evenlodeinvestment.com).
Recent performance information is also shown on factsheets, also available on the website. Past performance is not a guide to future returns. The value of investments and any income will fluctuate (this may partly be the result of exchange rate fluctuations) and investors may not get back the full amount invested. Fund performance figures are shown inclusive of reinvested income and net of the ongoing charges and portfolio transaction costs unless otherwise stated. The figures do not reflect any entry charge paid by individual investors. Current forecasts provided for transparency purposes, are subject to change and are not guaranteed. Source: Evenlode Investment Management Limited, authorised and regulated by the Financial Conduct Authority, No. 767844.
Market data is from S&P CapIQ, Bloomberg and FE Analytics unless otherwise stated.
Footnotes
-
Using the MSCI World index, data from Bloomberg.
-
Source: US Bureau of Labor Statistics, PIIE https://www.piie.com/blogs/realtime-economics/2025/who-paying-trumps-tariffs-so-far-its-us-businesses
-
Compound annual free cash flow growth for the MSCI World Index over three years to the first half of 2025 was +0.9% per annum in euros and +1.1% in sterling. Source: Bloomberg.
-
For those interested, median portfolio free cash flow growth was +4.8% in 2023, +6.1% in 2024 and +6.9% in the first half of 2025 in the reporting currency of the company. Over five years portfolio free cash flow in sterling has compounded at +4.3% per annum, whilst the MSCI World Index grew at +3.1% Source: Bloomberg, corporate reports, Evenlode.
-
Source: Gabaix, Koijen, 2021 https://www.nber.org/system/files/working_papers/w28967/w28967.pdf