What’s going on?
As we make progress through the first month of 2025, the global stock market has continued its rise despite a wobble as news of the popularity and apparent efficiency of the DeepSeek AI model was digested. So far, the Evenlode Global Dividend portfolio has kept pace, a contrast to last year’s relatively muted performance. As we are in a period of much change and market noise, (some technology driven, some market driven, and some driven by geopolitics), we thought it would be a good time to take stock of the current equity market and the portfolio’s performance within it.
Below, we will set out analysis based on the well-known dataset on the US equity market from Professor Robert Shilleri to set the long-term market context. Readers of the financial press may well have seen other articles using the same data, and we corroborate the near-term figures with analysis using other sources. We’ll look at the portfolio and the broader market through the same lens to enable comparison and get into some detail on moves in some portfolio holdings.
This all makes this missive somewhat longer and a little more technical than our usual monthly investment view. We hope it provides enough detail to help understand what has driven the portfolio’s return within a market which, not to give too many spoilers up front, does look expensive. The portfolio by contrast contains companies that are performing as expected and are trading at reasonable valuations or better.
The market context
As we have noted in previous investment viewsii, the fact of markets generating positive returns and hitting highs is not exciting in and of itself; it is what we expect as the global economy grows and listed businesses grow with it and is indeed what we’re after as investors in equities. There is particular excitement at the current time though as the last two years have provided bumper returns driven by the US.
The MSCI ‘World’ Index is now over 70% US-listed businessesiii and essentially all the MSCI World’s return came from the US in 2024. Hence, the recent global market context has largely been a US context. The last time such a significant stock market returns bonanza occurred was in the late 1990s during the now infamous Technology, Media and Telecoms (TMT) craze, also known as the dotcom bubble, and so comparisons are naturally being drawn. Some are wondering if current market levels are foreshadowing negative things to come, partly because the after-effects of that late-90s party were quite severe, and partly because of a sober analysis of the figures.
The US market is thus the focus now because of its dominance in market capitalisation terms of global indices, recent returns helped by its information technology sector (especially AI-related companies) and because it seems on some metrics to be expensive. It is also because the incoming US administration has numerous policies on the agenda that will affect many businesses, both domestically and internationally.
Any equity investment strategy aims for positive returns, and our objective is to harness the power of companies’ compounding over many years, whilst managing risk. We generally let the businesses do the work, being patient and giving them the time required to do so. However, over shorter time scales this can mean that the view of the market can be focused on businesses other than those that fit our criteria, with the excitement being elsewhere. Another way of putting it is that we think ultimately fundamental business performance drives shareholder returns, but sometimes market prices deviate from what is justified by those fundamentals. Here we will look at the long-term context in which current market levels sit, and the Shiller data provides us with a useful history.
Given that the Evenlode Global Dividend strategy has underperformed others and the market in recent times, we are interested in a longer-term view of a market that sets the context for performance of the strategy we run. Since we are fundamentally investors in businesses, we also want to bring in a view on business performance as that is important to our strategy too; we want to understand if we are doing our job of managing business opportunity and risk appropriately, as well as owning companies when their market valuations are justified.
Some recent history
One straightforward way of looking at the market context is to simply look at the returns that have been delivered over a reasonable period of time. The chart below shows the annualised returns delivered by US stocks over the prior 10-year period to the relevant date (e.g. the 2023 figure shows returns from 2013 to 2023), both in nominal terms and after adjusting for inflation, since 1980 - a time period that also happens to span Ben P’s entire life so far.
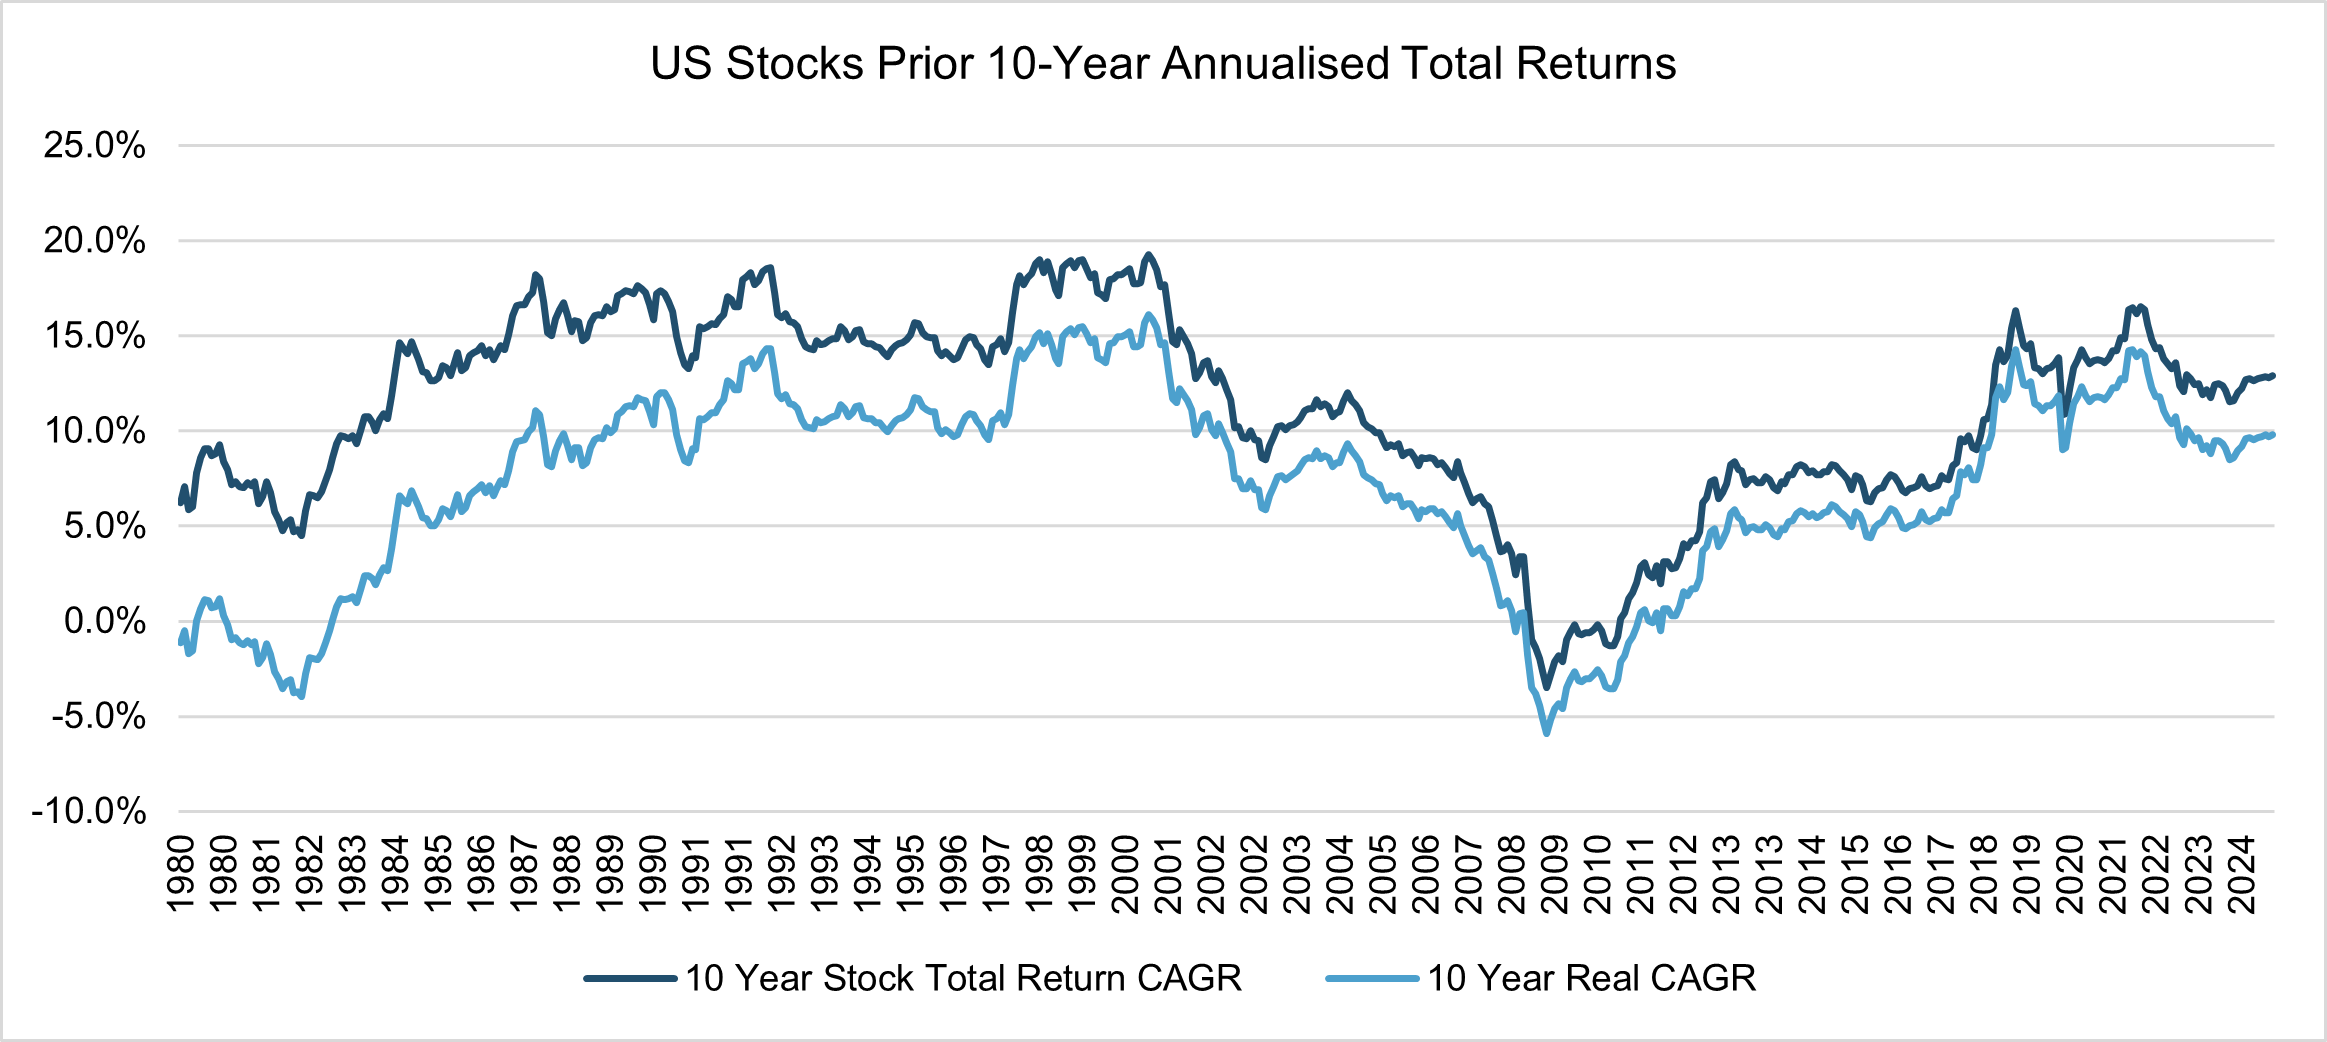
(CAGR = Compound Annual Growth Rate, the annualised growth rate. Total Return CAGR includes returns from dividends. Real CAGR is adjusted for inflation).
The 1970s and 1980s saw persistently high inflation, so the difference between nominal and real returns is noticeably larger in the early part of the chart. In the decade to 1980, US stocks returned less than nothing after taking inflation into account, in part a reflection of the challenging economic times but also a result of valuations in the stock market at the beginning of the 1970s. The rate of inflation fell through the 1990s and 2000s so the real and nominal returns are closer in value.
Clearly the starting point for measuring returns over a particular period matter, but in broad terms the recent solid stock market performance is comparable to that delivered in the 1990s particularly after adjusting for inflation, hence the comparisons being drawn with that era.
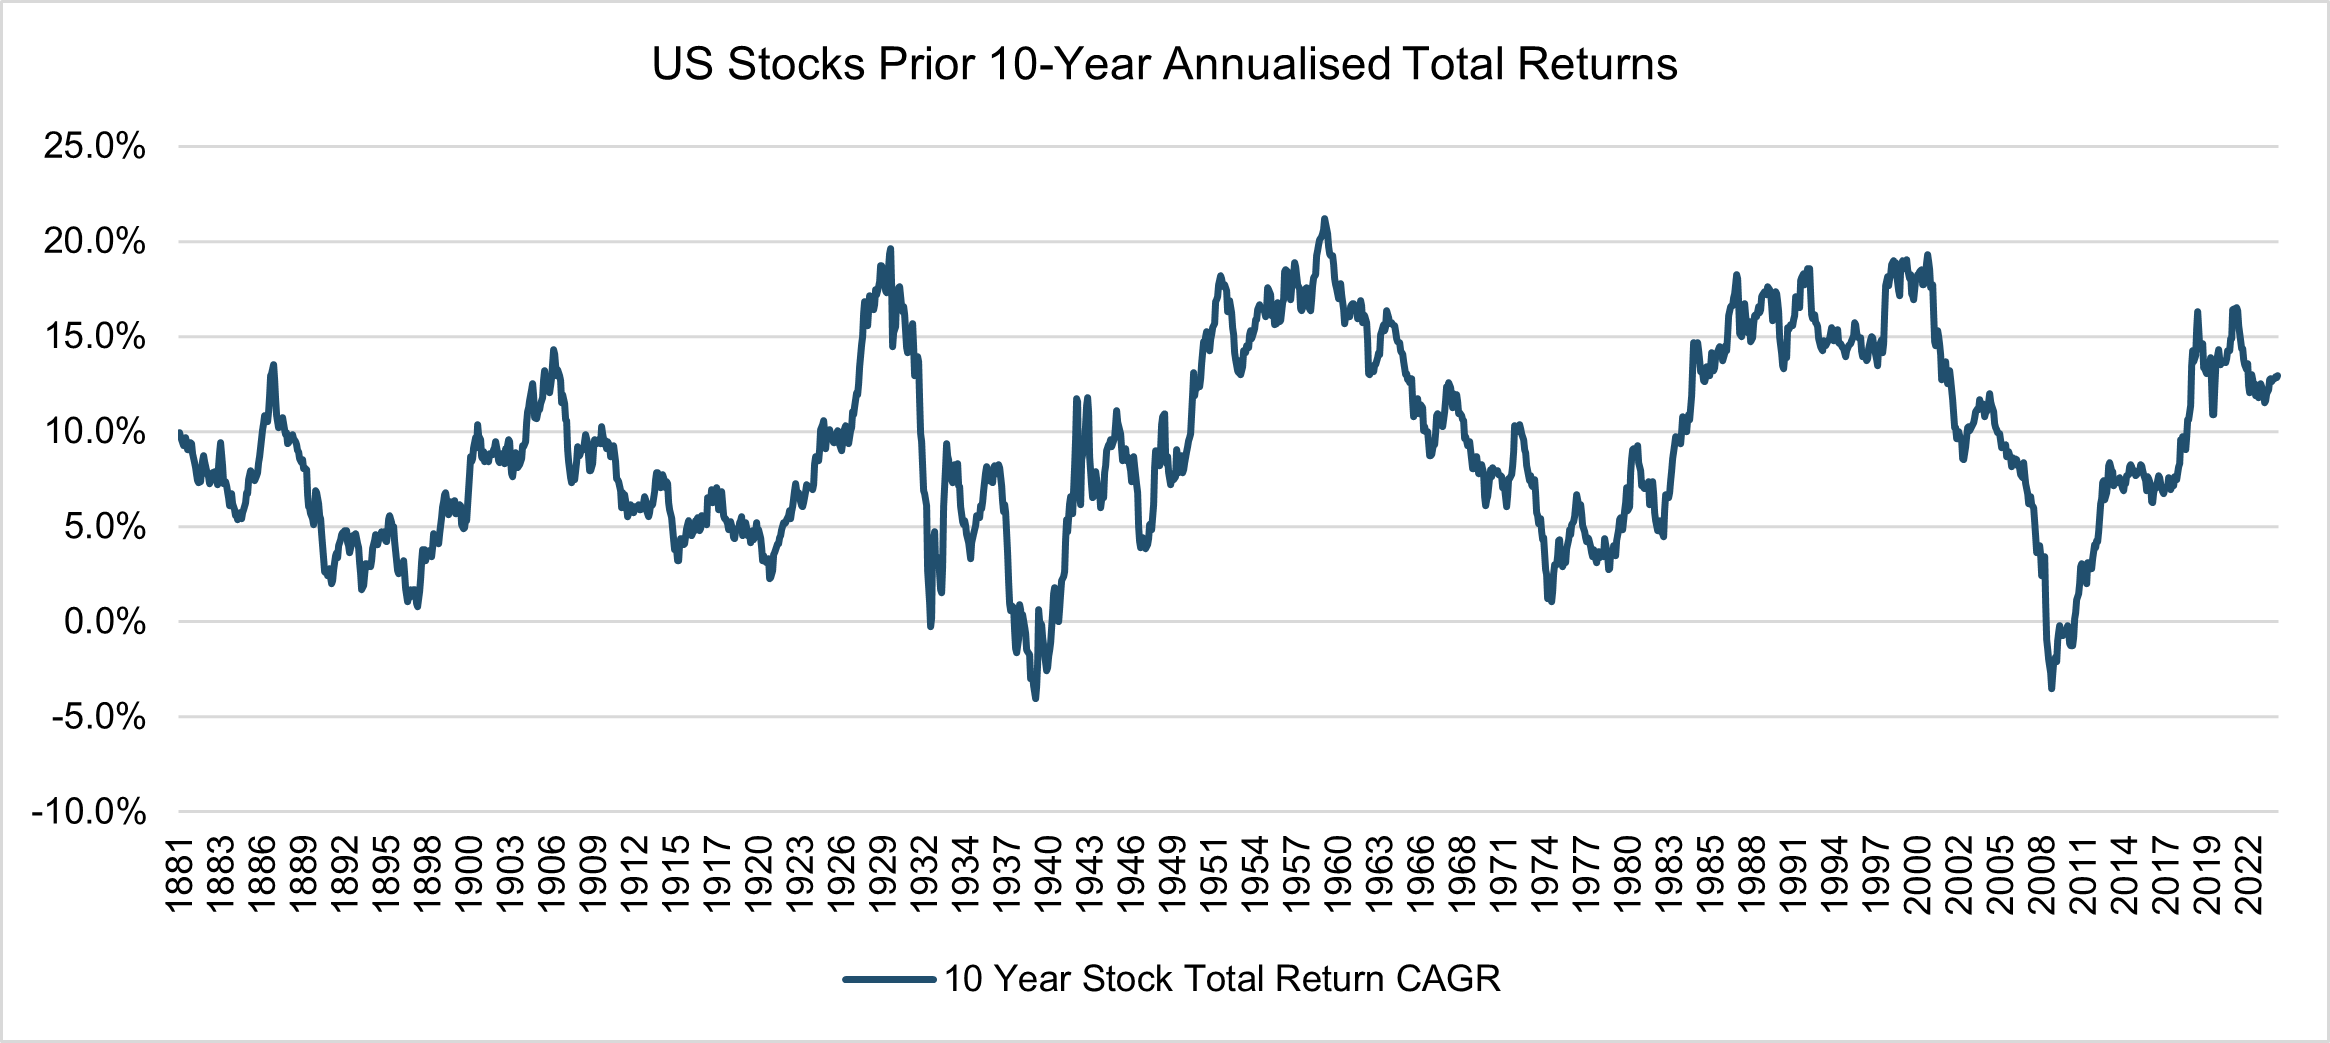
Looking at a longer sweep of history, we see that there have been several periods where similarly high returns have been delivered by US stocks. In the post-war boom of the Fifties the markets were off to the races, as they were in the Roaring Twenties. Unfortunately for stock market investors, both of these fabled periods ended with disappointing returns in the following decades.
However, this is a view of the market looking at prices alone and this doesn’t quite give the whole story. To understand drivers of market moves, one can split out the share price changes into changes in earnings, and changes in earnings multiples, i.e. how many years of current earnings an investor is willing to pay for up front (from here simply referred to as ‘multiples’). The former (changes in earnings) is an indicator of fundamental business performance, the latter (changes in multiples) an indicator of the change in market sentiment and estimates of future earnings growth. Often the market reacts to short-term changes in earnings and magnifies them through changes in valuation. Given the volatility and competitiveness of the world of business and the economy, it is unsurprising that good companies sometimes have bad years, and vice versa, much like elite sports teams (just ask Manchester City right now).
If the market over-reacts, perhaps by extrapolating a poor year or two far into the future, the earnings multiple applied to the business will drop, often substantially. Lower earnings and the lower multiple combine to dent a company’s market value, sometimes significantly, which is damaging to short-term share price performance but can also offer an opportunity to invest at a great price for those who choose to look further out, and don’t mind waiting. The opposite can of course happen too, with earnings growth being accompanied by expanding multiples as the market prices in future expectations of growth, supercharging returns.
We’ll return to these points in detail below, but at a market level the next chart shows how earnings growth and earnings multiples have progressed over 10-year periods since 1980.
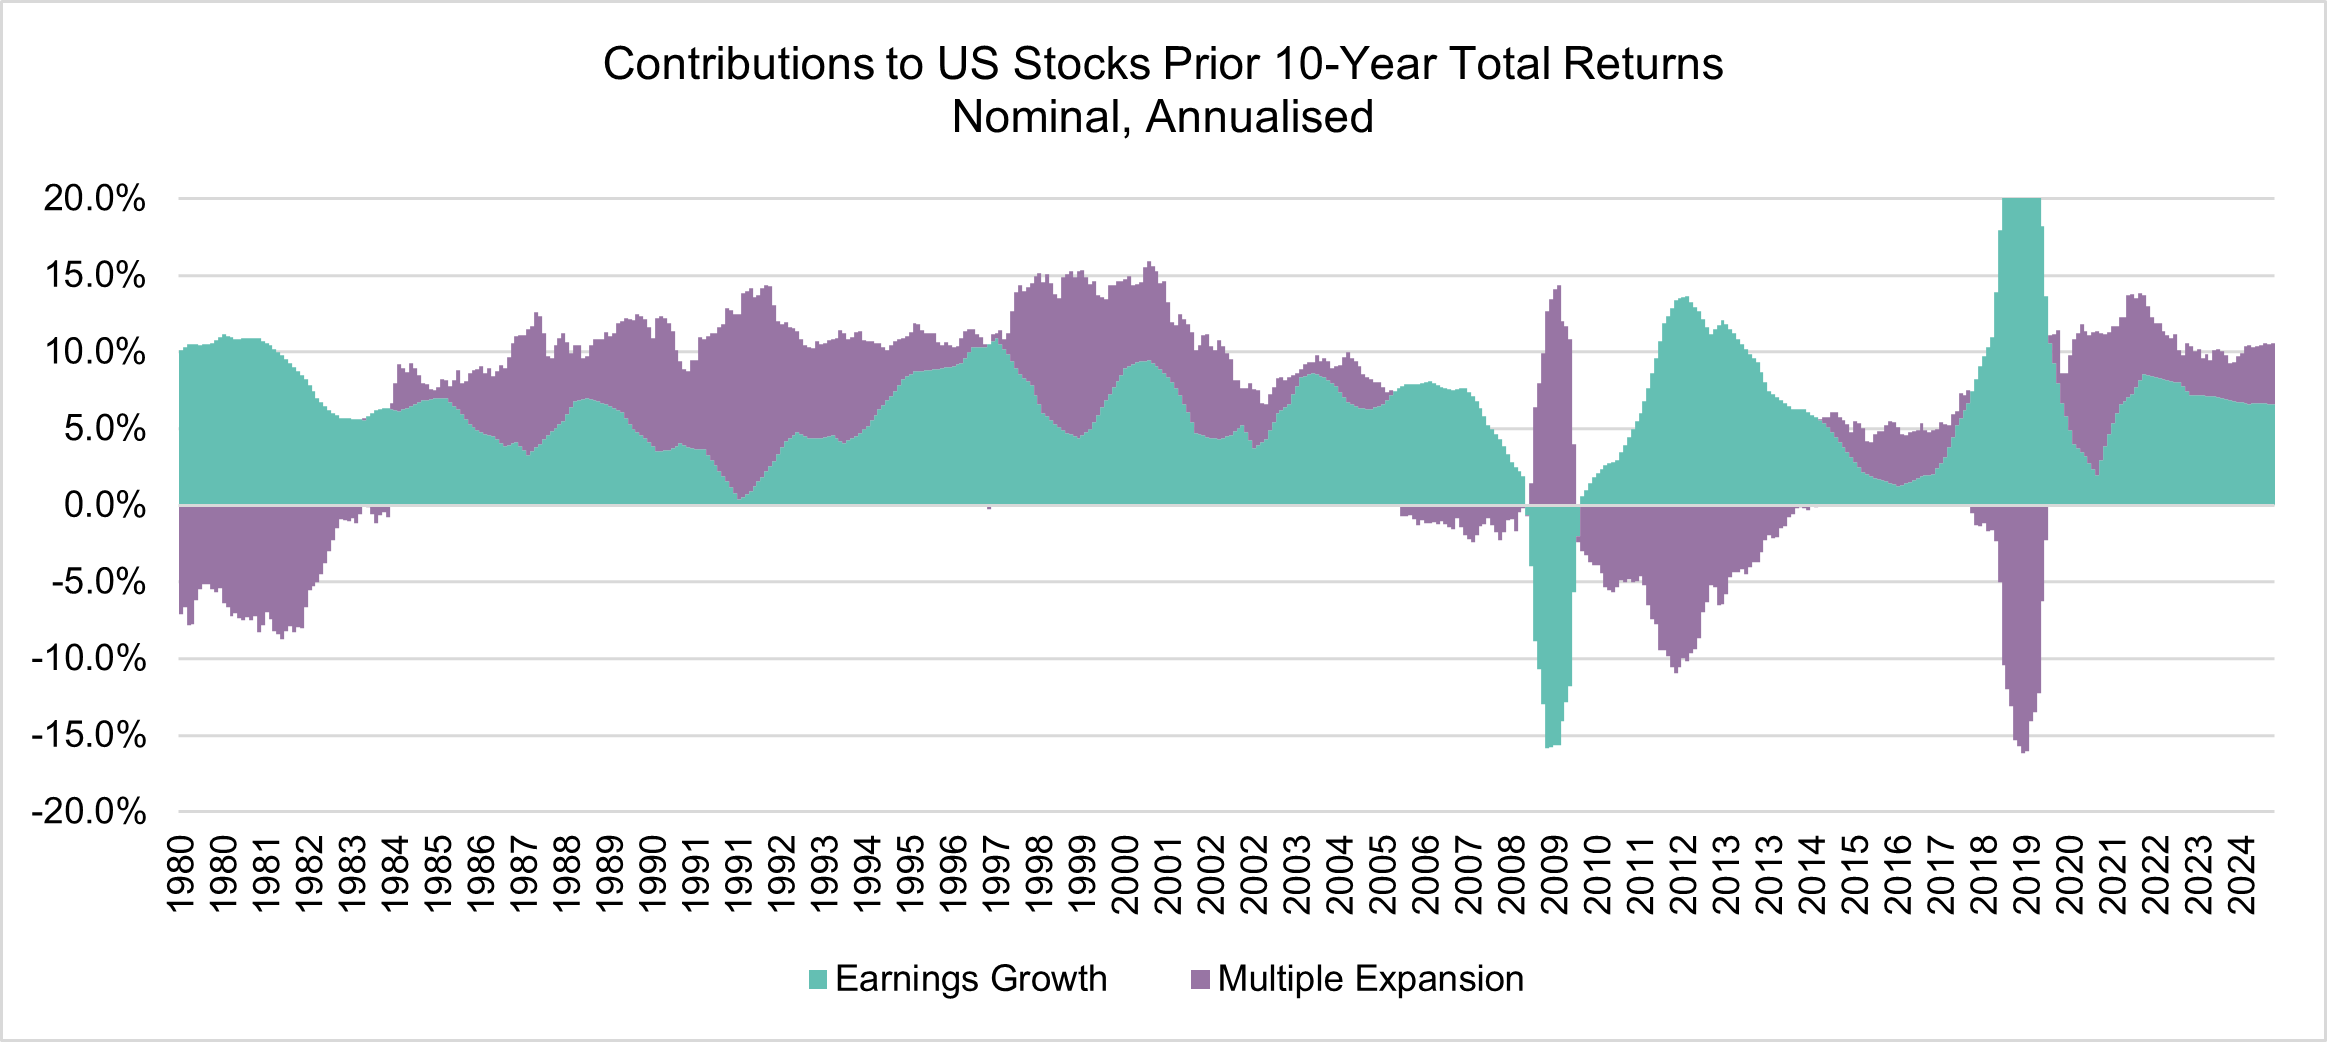
The chart above shows that earnings growth has been the bedrock of equity returns. As it is profits (or, actually, cash flow) that equity investors receive, this rising profit stream is the reason the stock market can deliver growth through time. Again, the starting point matters; 10-year earnings growth spiked in 2019 because it is lapping the earnings collapse witnessed by companies in the Great Financial Crisis of 2008-2009. But broadly, earnings growth has been steadily positive.
In a world of relatively steady earnings growth the gyrations in long-term stock market returns are therefore caused by changes in market valuations (earnings multiples). Changes in multiples have proven to be volatile on a timescale that is appropriate for equity investing. In the above chart we see that multiples running into the 1980s fell despite earnings rising, leading to the ‘lost decade’ for returns of the 1970s. Multiples expanded significantly through the 1990s, then contracted through the 2000s after the dotcom bust which ultimately combined with the collapse in earnings in the Great Financial Crisis to greatly negative effect.
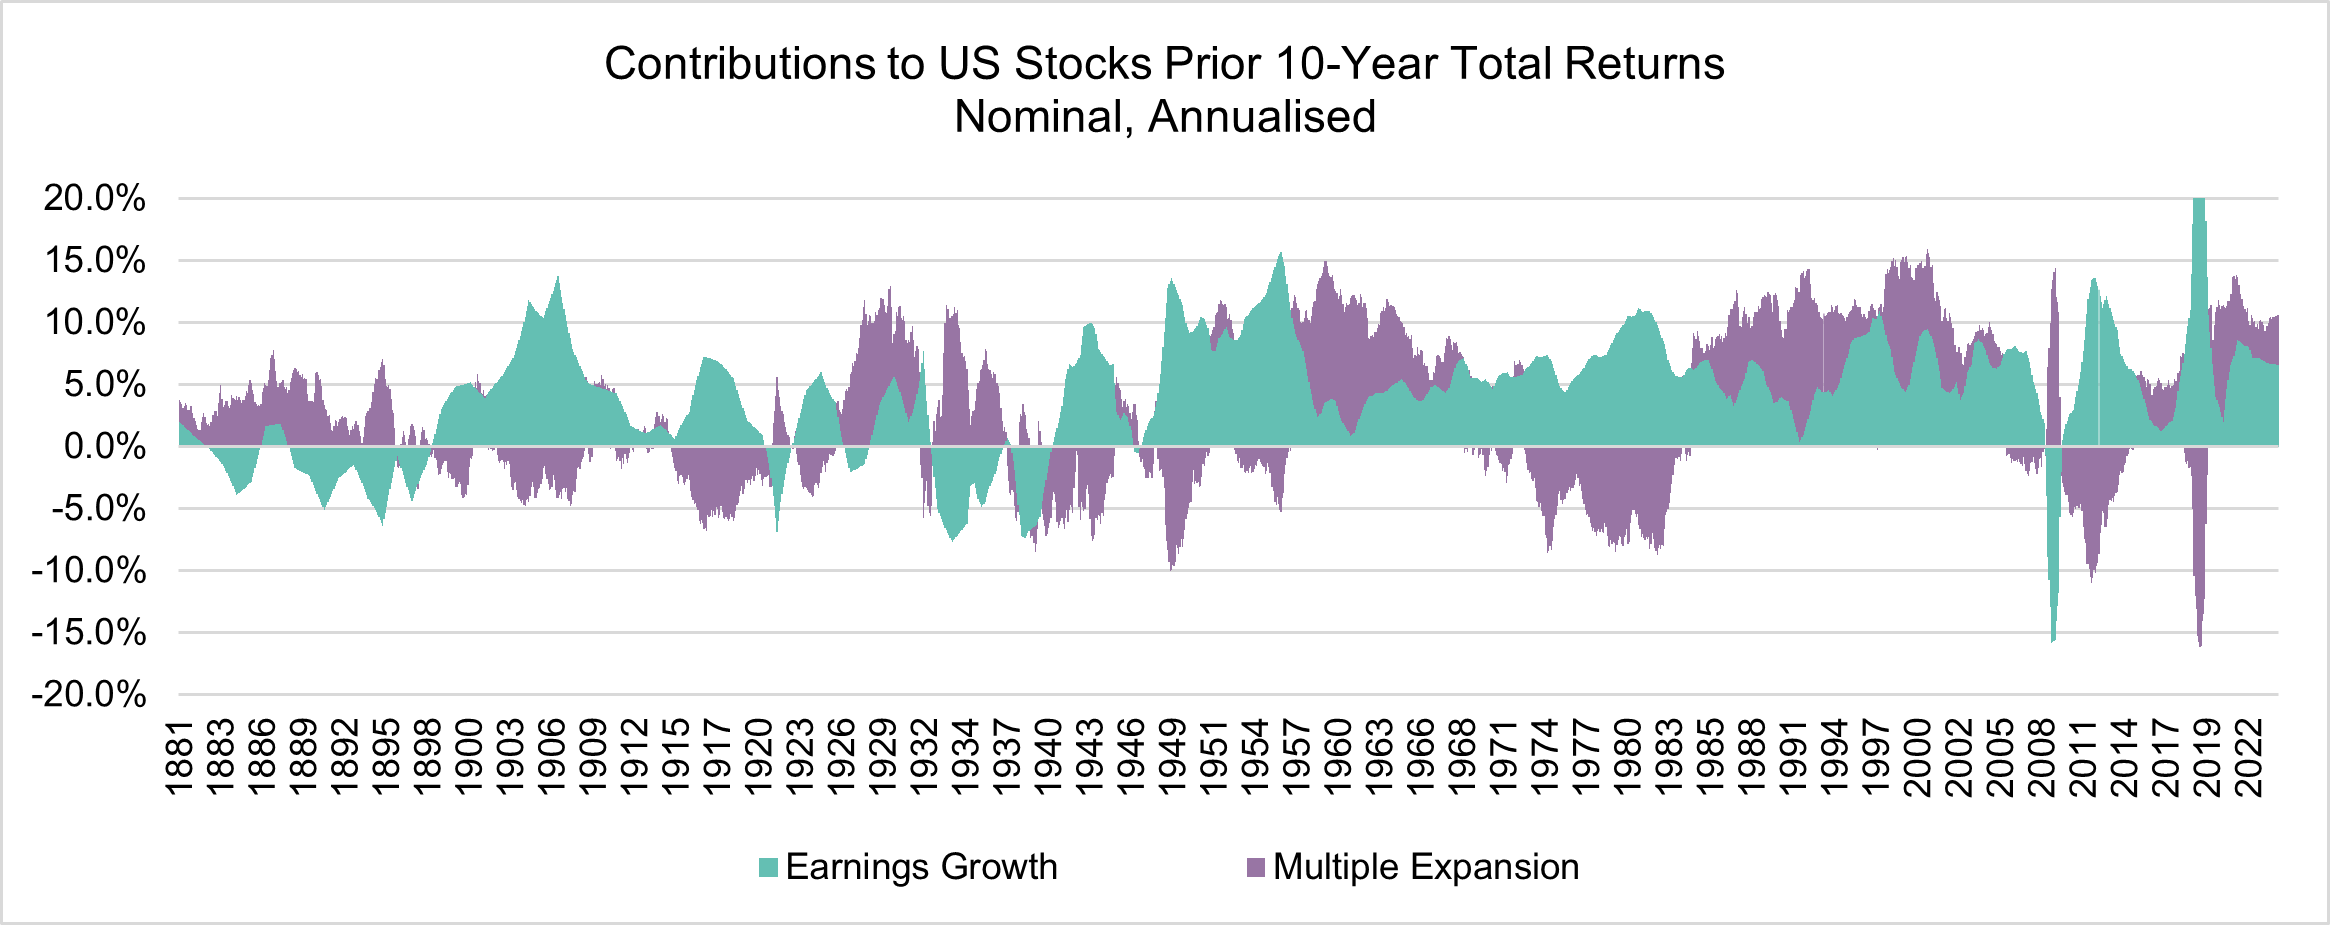
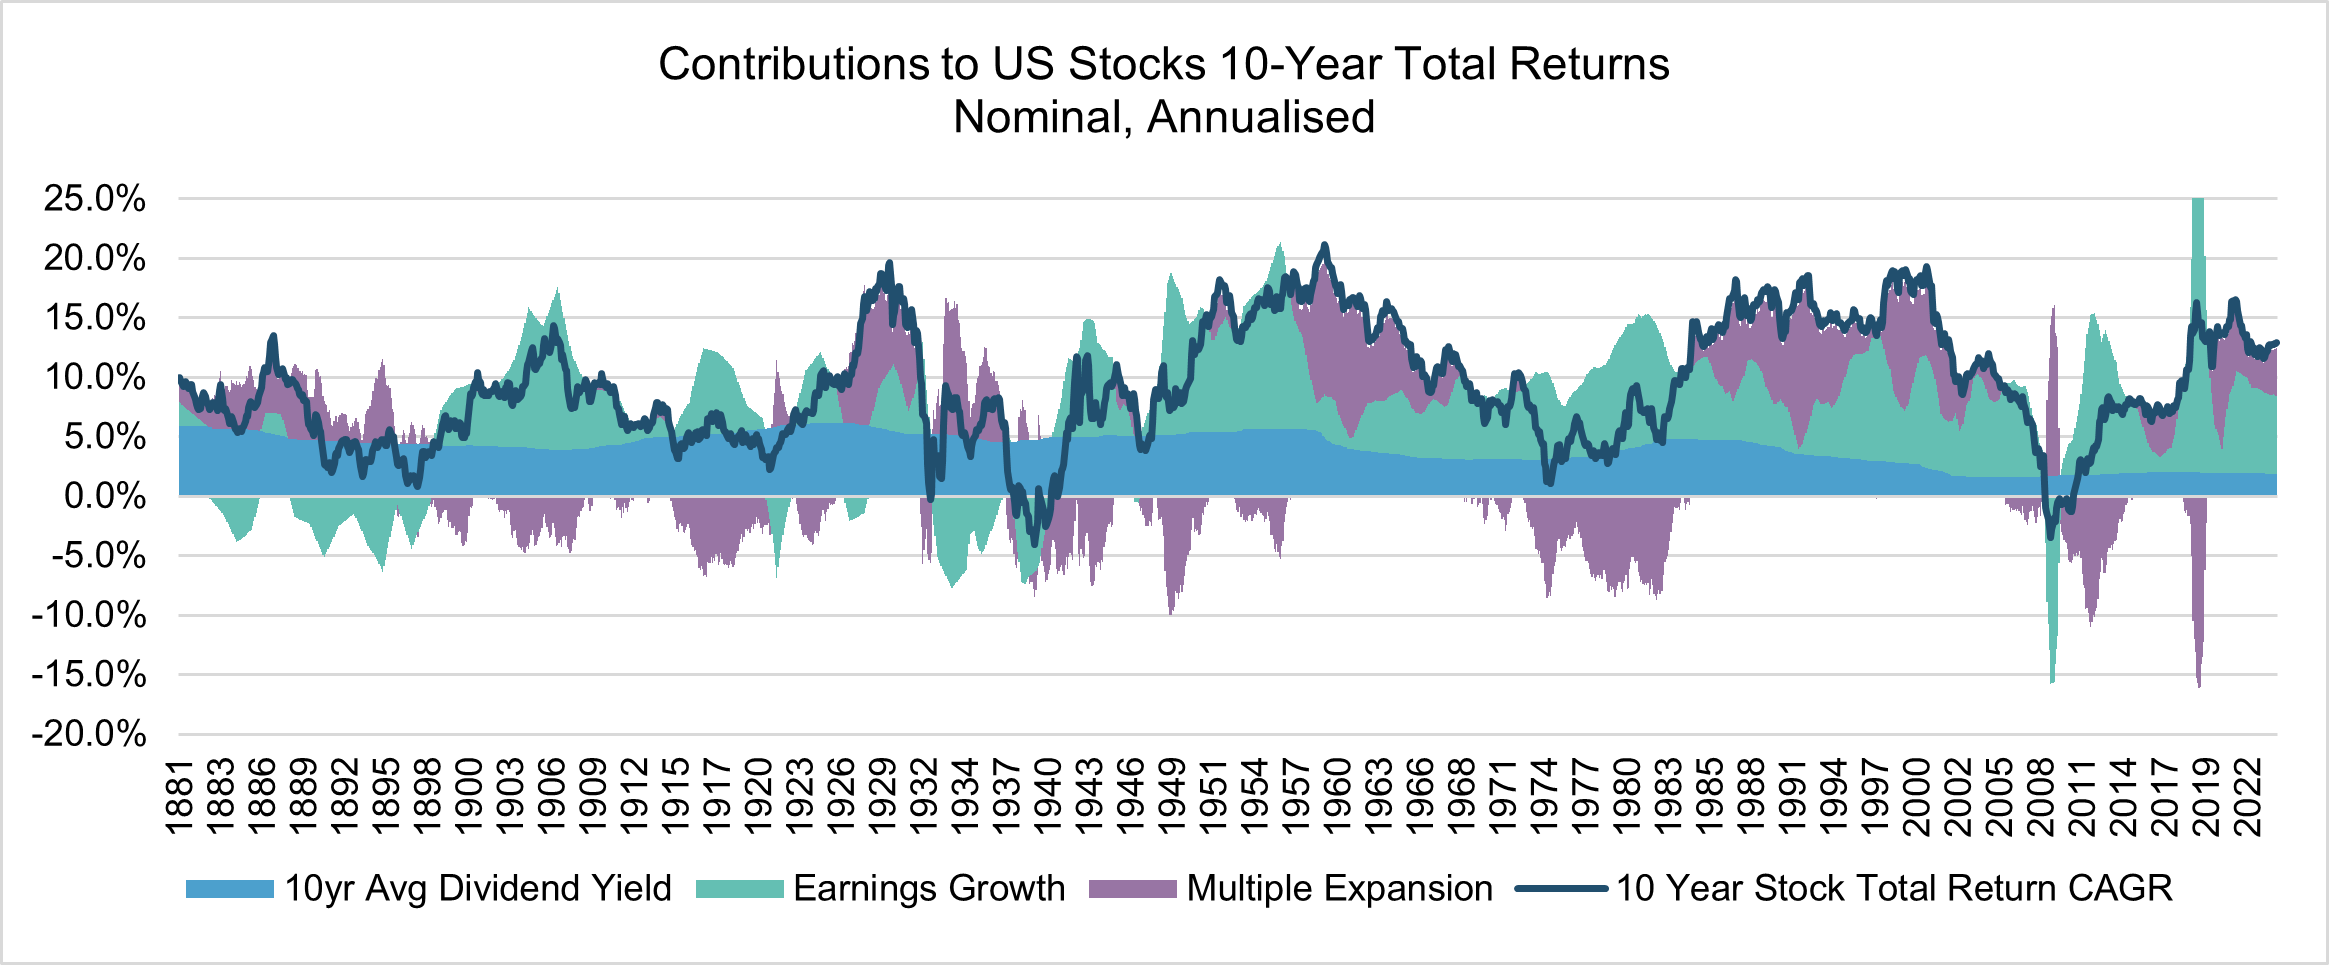
Once again, zooming out to the broader sweep of stock market history, in the chart above, we see that periods of earnings multiple expansion and contraction are quite normal. We also see that they can play out over quite long periods of time. The multiple expansion that drove returns in the ’Swinging Sixties’ took a decade to unwind.
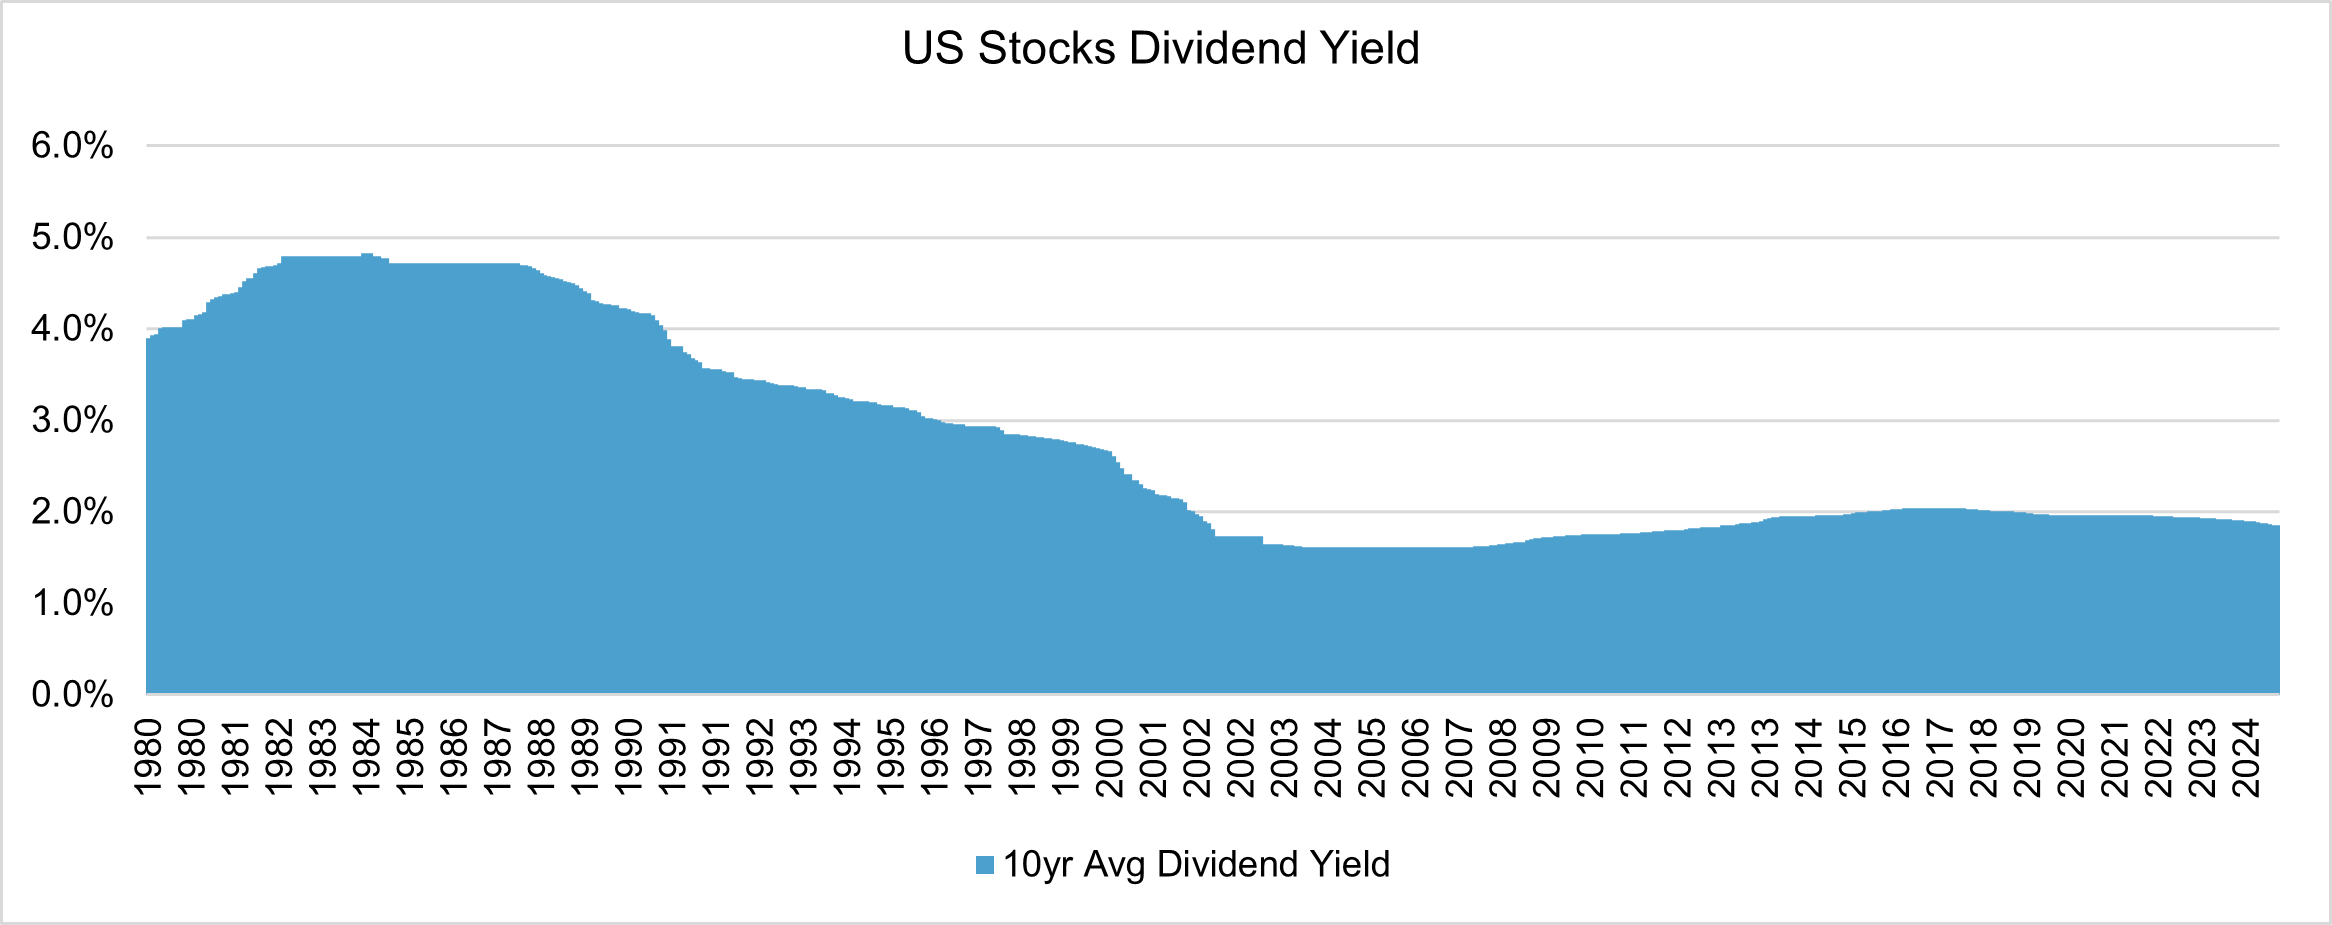
The final component of total stock market return is dividends, one that is important to us as income-focused investors. We seek a growing income stream for our investors and a reasonable starting yield. US companies do deliver income but tend not to use dividends as a method of returning cash to shareholders as much as European companies. Yields have also materially changed over time, as we moved from the high inflation and associated high interest rates of the 1970s and 1980s through the ‘great moderation’ of the 1990s and 2000s, and then the zero-interest rate monetary environment following the Great Financial Crisis. Rates have increased post-Covid, but interestingly equity yields have not on the whole at a market level, especially in the US.
Joining the dots
Bringing the drivers of stock returns together: earnings growth, changes in valuation multiple, and dividend yield, we see clearly what drives market prices. Earnings growth and dividends are the bedrock, around which swings in returns are driven by changes in valuation. For the final time we take a look at the market since 1980, with all of the ingredients in place.
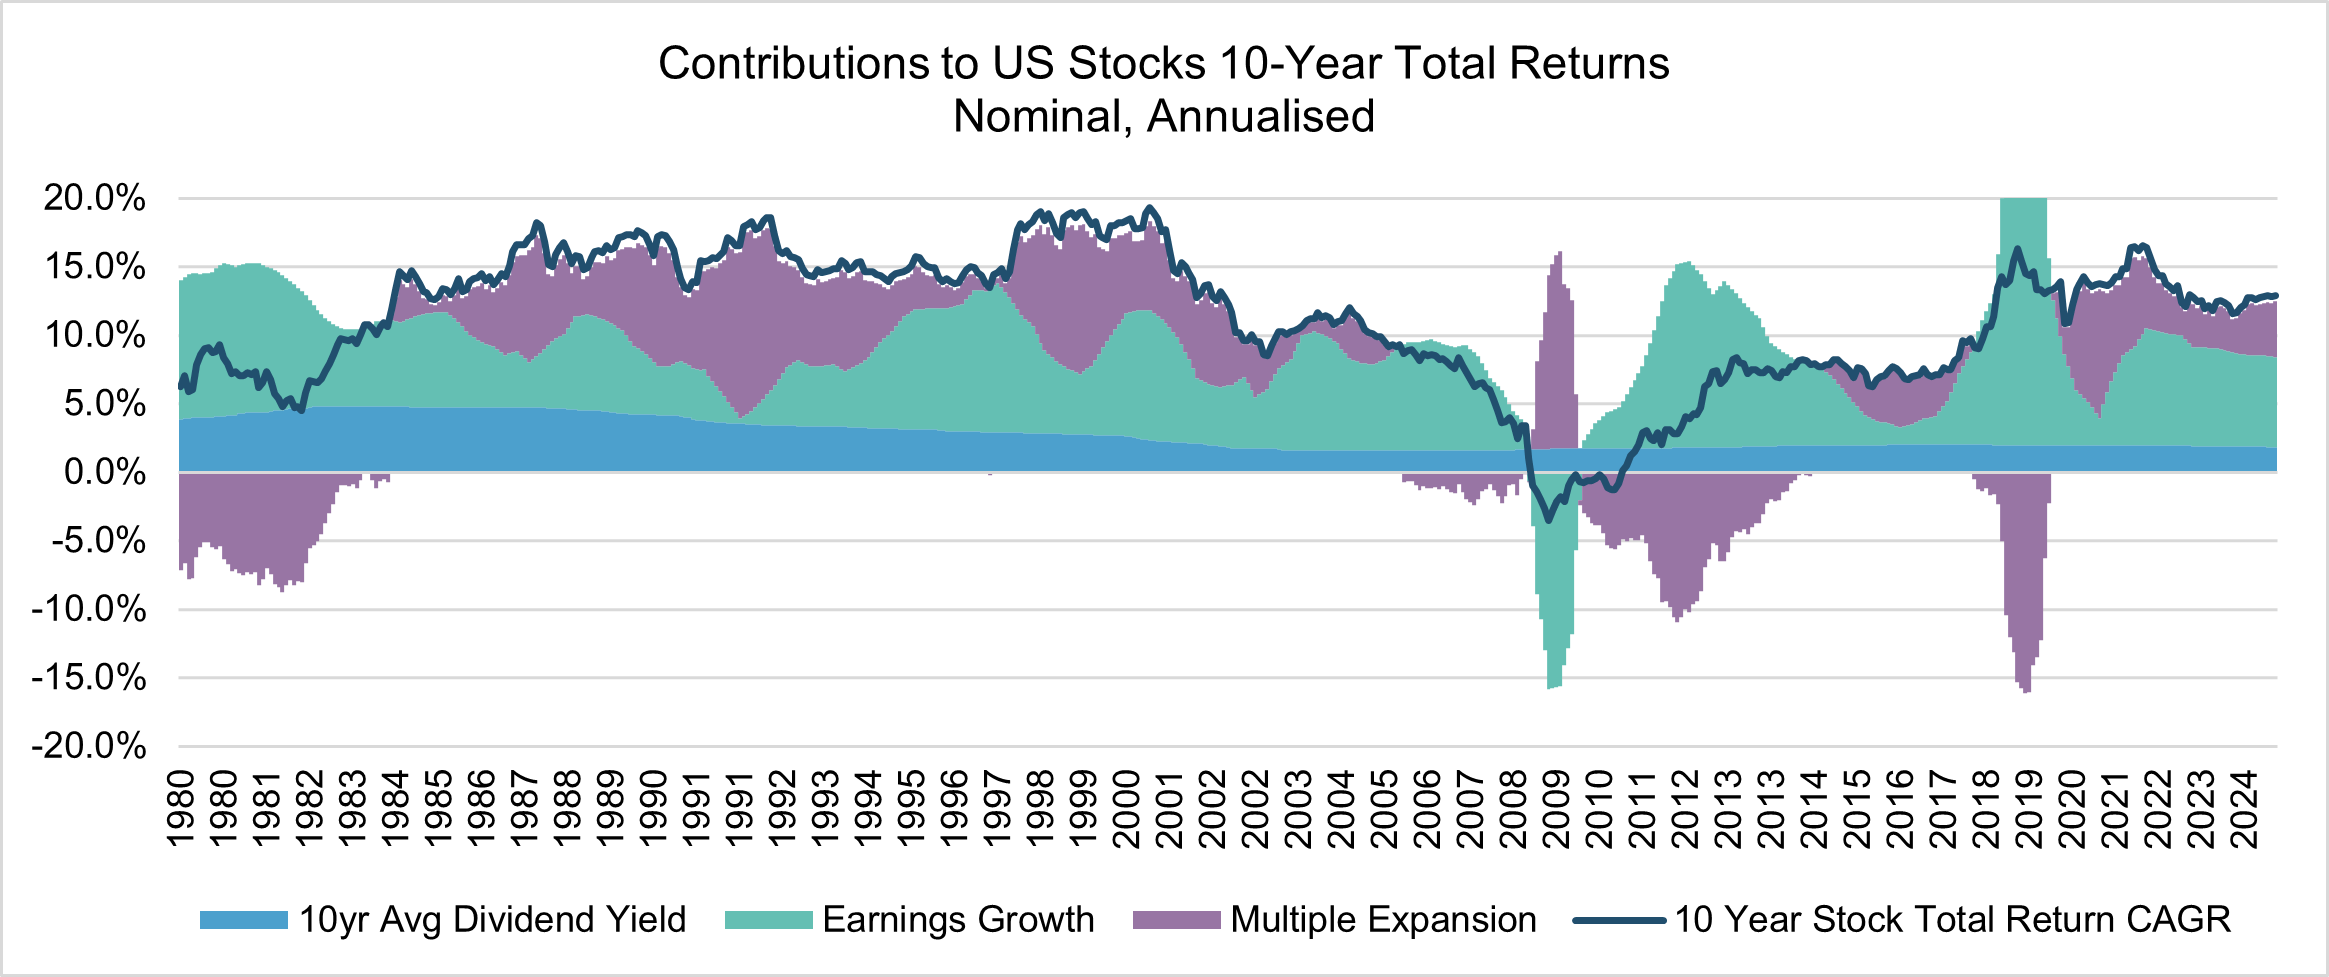
Since 1980, periods of high returns have been driven by multiple expansion and followed by periods of lower returns driven by multiple contraction, while earnings growth and dividends (which are driven by earnings) have remained fairly stable throughout. There have been periods of slower earnings growth, and outright contraction during the Great Financial Crisis, but these have been short-lived. This pattern plays out looking at the broad sweep of US stock market history, particularly in the post-war 20th Century.
Back to the present
The fund’s formal performance comparator benchmark is the MSCI World Index, where over the last year multiple expansion has been a material contributor to returns, along with earnings growth, led by US mega-cap tech companies, banks and other cyclical sectors (as we will detail later). The Evenlode Global Dividend portfolio’s returns were driven by earnings growth but did not benefit from substantial multiple expansion like the market. Instead, the portfolio’s earnings multiple contracted.
Currency movements add some volatility to the figures, but the conclusion is the same. The portfolio contains good businesses trading at attractive valuations, while at the same time profit, cash flow growth and dividend growth are good. While earnings growth in 2024 was slightly behind the benchmark due to sector differences and cyclical market drivers, the yield is larger and growing ahead of earnings as dividend payout ratios are rebuilt post-Covid driven by recovering free cash flows.
At Evenlode we work to harness the power of companies that can churn out compounding from good earnings and dividend growth, funded by high returns on the capital invested in the business, while protecting our clients from the gyrations in valuations. We are currently in a period of high market returns driven materially by multiple expansion. Looking to the future, history suggests that today’s environment is one where managing valuation risk is critical. The challenge, as we have seen historically and more recently through the Covid and post-Covid period, is that the timescale over which the expansion and contraction of multiples, driven by sentiment and economics, can last for quite some time.
In part the multiple contraction is because of our portfolio management activities over recent years, buying more into good companies as they fall in price more than our estimates of value suggest they should, and gradually selling if the opposite happens. That is the way we manage valuation risk for our clients, but on a relative performance basis this does not help in the near-term if market multiples rise significantly, as they have been doing. In part that’s a European thing. If virtually all the global market’s returns have been from the US, it follows that Europe’s have been modest, as they have been. As to why, we will shortly take a look at some portfolio holdings that exemplify the trend.
As to the outcome, the fund’s returns have not been as high as we would like on an absolute or relative basis. Looking at the future though, solid overall business growth, a growing dividend yield and undemanding valuations are attractive characteristics on both an absolute basis and relative to the market. A reasonable basis for long-term total return that is grounded in company fundamentals is the growth in per share free cash flowiv plus the free cash flow yield you get today. The Evenlode Global Dividend fund currently has a c5% free cash flow yield. Our universe of companies has compounded free cash flow per share at about 9% since 2000, and expectations for 2025 are that the portfolio’s free cash flow growth will be higher than this.
Portfolio review
Now it is time to get into the details at a company level. There were plenty of portfolio companies that delivered positive returns in 2024 which we’ll get to, but first looking at the ‘business end’ of contribution, the following table shows the top detractors to performance for the year. (please note: contribution tables and charts in the Portfolio review and Sector review sections below are based on the IFSL Evenlode Global Income fund, which the Evenlode Global Dividend fund portfolio mirrors).
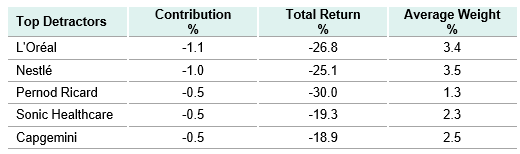
Looking at these companies in a similar way to our market and portfolio deconstruction above, we see the reason why the share prices have declined. Profit growth has turned negative with the exception of L’Oréal, which has slowed. More importantly, on top of that there has been a significant derating seen through the earnings multiples fallingv.
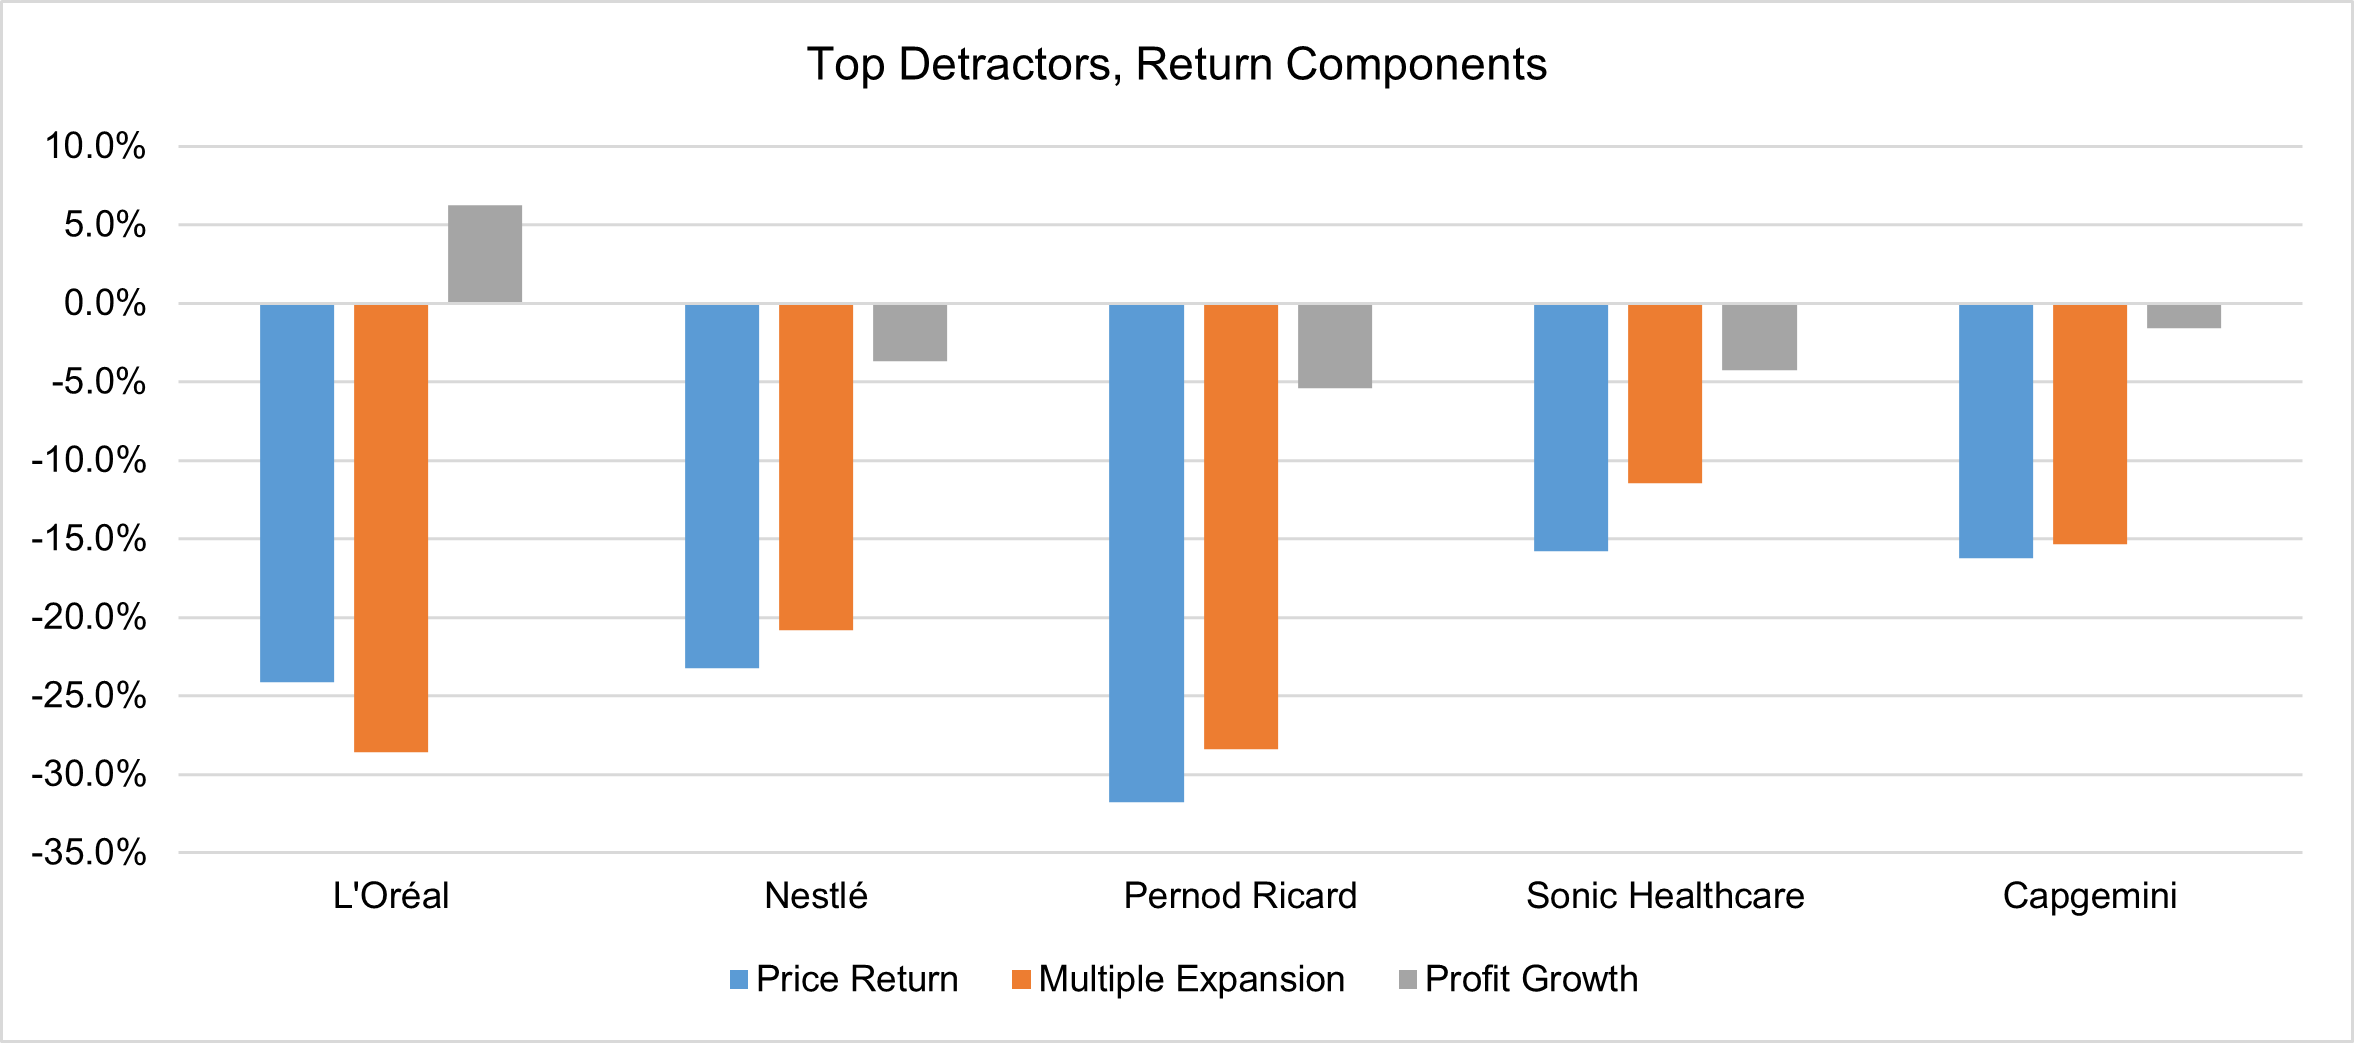
For all, the substantial decline in earnings multiple was the main contributor to share price declines and far more of a factor than the moderate declines in earnings. For each, we think that the structural characteristics of the businesses remain unchanged and that the valuation declines present an opportunity to capture their qualities at discount prices.
Looking at the three consumer goods companies that have seen the most significant multiple contraction, the near-term story is clearly showing a slowdown, but their ability to churn out cash flow over the long run seems, to us, to remain. For many industries the Covid pandemic led to super-normal consumption, and for companies with pricing power, the inflation that followed pushed revenue growth up above their natural rate. Unsurprisingly, these trends have been normalising over the past year or two.
L’Oréal is the global market leader in beauty products, with an unrivalled portfolio of brands and track record. Their gross margin of over 70% is indicative of their pricing power. Results in 2024 were solid, especially considering they came on top of strong post-Covid demand. Organic growth for the first nine months of 2024 was 6%, and while they have seen some weakness in China and US dermatology products, the diversification of the group has proved its worth. Thinking forward, beauty is a human desire that remains timeless and profitable.
Nestlé is one of the largest consumer goods businesses in the world. Their economic moat is based on the strength of their brands, their ability to invest behind them and their distribution advantages. While the recent popularity of GLP-1 weight loss drugs has raised questions around future sales for chocolate bars like KitKat, confectionary is less than 10% of sales. Most of the business is from coffee, pet care, and infant and medical nutrition. Nestlé were something of a stock market darling during the past few years as organic growth was propelled by in-home coffee consumption and higher pet ownership out of the pandemic. We never assumed that level of elevated revenue growth would continue, and it is now normalising.
Pernod Ricard is the second largest spirits producer in the world after Diageo. Unlike wine, their products are consumed over time, which introduces a level of risk to the purchase and consumer trust in the brands. Both Pernod and Diageo have struggled recently as inventories are normalising from an elevated level. During the pandemic, drinking at home increased and people stocked up their pantries. Subsequent inflation caused distributors to stock up further to get ahead of future price increases, given spirits are durable goods. This resulted in an overload of inventory which is taking some time to work through and naturally this blip in performance has led to existential narratives questioning their future. Our analysis suggests that the data does not support this but reflects the ongoing inventory normalisation, a feature of an independent distribution system where inventory swings happen from time to time. Our view is that Pernod’s valuation is one of the most attractive in our investable universe.
To cover the other two top detractors, medical testing outsourcer Sonic Healthcare is seeing the tail end of pandemic-era testing volumes come back to normal. IT outsourcer Capgemini has been seeing a slowdown in corporate and government spending on projects (perhaps counter to the AI-driven narrative in the market), which was showing signs of reversing in the latter part of 2024.
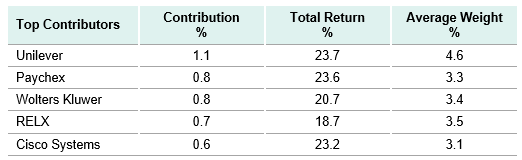
Short-term operational performance is not a proxy for the quality of a business, and we focus on the latter and try to determine if current challenges are transitory. This is of course a judgement but if valuations are attractive then this provides a margin of safety, and we are willing to be patient. Our top contributor over the last year, Unilever, is an example of how these scenarios can turn around. In the past few years there has been a lot of negative sentiment around the company which was reflected in their attractive valuation. In 2024 their share price increased 20%, mostly from an increase in their valuation multiple, while results came in as we would have expected. Such was the valuation opportunity that we continue to think that Unilever continues to provide good value on a long-term basis, despite their recent outperformance.
On a fundamental business performance view Unilever exemplifies the broader trend we are seeing in the portfolio. There were some challenges to free cash flow through and after pandemic times, but these were managed, and operations are pretty much back to normal with cash flows generated from the business forecast to rise over the next two years. For the portfolio we are potentially looking at free cash flow growth in the low double digits in percentage terms over the next two years. This statement is based on analyst estimates from research houses and as with any forecasts should be taken with something of a pinch of salt. Nonetheless it is helpful as a sense check that the apparent valuation opportunity we’re being offered is grounded in expected business performance, which is the most important thing.
A notable feature of the top detractors is that none of them are US-listed. We believe this is primarily down to valuation movements, not long run company fundamentals. The following chart shows how our primary long-term valuation metric, the Forward Enterprise Return (FER), has changed for US-listed and non-US listed companies in our wider investable Universevi. The FER is a form of discount rate, so higher values indicate cheaper valuations.
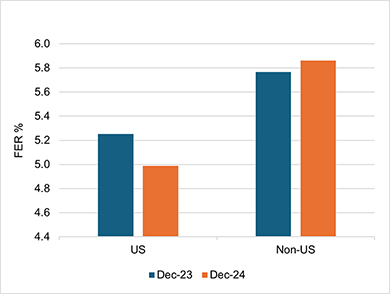
Data based on EGD Universe FER
On our estimate of long-term valuations, in 2024 US-listed companies became more expensive, while non-US companies got cheaper. The increase in US ‘expensiveness’ was much larger than the increase in ‘cheapness’ for companies listed outside of the US, speaking to the skew of US moves. We thus ended 2024 in a position where quality was available at perfectly reasonable prices outside of the US, whilst increased selectivity is required to find value in the US market.
Switching to the positive side of the returns ledger, for the portfolio we do see a couple of US companies, Paychex and Cisco Systems, where we had seen good valuation appeal, but three European-listed businesses also feature in the top five. Unilever we’ve already mentioned. Data, software and analytics businesses Wolters Kluwer and RELX have certainly benefitted from market positivity around AI, showing that one doesn’t necessarily need to be in Silicon Valley to capture the benefits of the emergent technology. In fact, given enterprises are naturally risk averse and trust is critical when considering adopting a new service, business service companies that own large, curated proprietary datasets, like RELX, Wolters Kluwer and Experian, are extremely well placed to differentiate themselves if AI gets adopted by the economy more broadly.
We certainly welcome positive returns, and we retain holdings in all these businesses as the valuations are acceptable, albeit less attractive than they have been in the past. We have thus reduced the position sizes through the year as valuations have increased and the future risk/reward balance has shifted somewhat from the latter to the former.
Sector view
‘Technology and cyclicals’
While the US has dominated performance from a listing perspective, the spread in outcomes from sectors has been very wide. Looking at our underlying portfolio holdings, a large portion of the difference between the fund’s performance and the benchmark can be seen in the fund’s sector allocations. The following breaks down the performance comparison by sectorvii, showing the main detractors including the consumer goods sector already discussed.
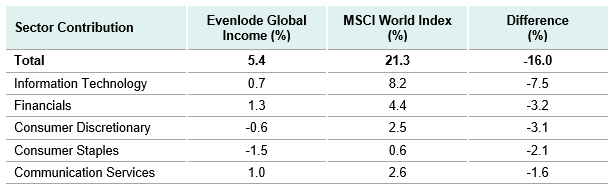
Information Technology contributed 38% of the benchmark’s return and accounted just under half of the performance difference between the fund and the benchmark. Within this, NVIDIA accounted for 17% of the benchmark’s return and Apple accounted for 7%. Notably Apple’s earnings growth in 2024 was only 2%, meaning almost all of their 26% return came from valuation expansion, their PE ratioviii increasing from 31 to 39. This contrasts with the rest of big tech, whose returns were mostly driven by earnings growth.
The Financials sector was driven by banks, which performed strongly in 2024 as interest rates stayed higher for longer than the market expected, driving increased banking profits. Banks do not fit our investment process for a few reasons, chiefly because they generate inherently low returns on invested capital, and partly because they are cyclical, amongst other reasons. Nonetheless, we have long said that it is perfectly possible to make money investing in banks at the right time, and last year was one of those times.
Amazon was the main contributor to the performance of the Consumer Discretionary sector within the market, accounting for 5% of the overall benchmark’s return. Tesla was also a material contributor in this sector. While we own Amazon in the Evenlode Global Opportunities fund, the lack of dividend precludes it from our income investable universe.
Consumer Staples’ positive contribution to the benchmark mainly came from retailers, particularly Walmart and Costco. We currently don’t have any retailers in our investable universe, with generally thin margins and a lot of competition being a feature of the market. That said, some US retailers have certainly performed well in fundamental terms.
Communications Services was driven by Alphabet, Meta and Netflix. 2024 was notably the year that both Alphabet and Meta started paying a dividend, joining Microsoft and Apple in the ranks of world-beating tech companies that use this old-fashioned mechanism of returning cash to shareholders. However, the amounts they are paying are small and therefore they are not in our investable universe. There is certainly room for their dividends to grow and perhaps this will change in the future.
In summary, the total relative drag from not owning the companies mentioned above was -11.4 percentage points, or 54% of the benchmark’s return for the year. The balance was largely from the Consumer Goods sector as discussed above.
Trends driving the market
So, we’ve seen that Evenlode Global Dividend’s fund return in 2024 was driven by earnings growth and dividends, while multiples contracted, whereas the global stock market’s return over the recent past has been driven mostly by multiple expansion.
That could be rational - if there is an expectation of accelerating earnings growth in the future, and this comes to pass, then higher multiples will naturally come down and look more reasonable. AI chipmaker NVIDIA has experienced exactly this. However, whilst US growth has remained robust, the world’s largest economy still does not represent most of global GDP and the global growth picture is pretty mixed at best. As we have shown, history tells us that earnings growth is generally relatively stable. So, whilst there is some impetus to upward prices from earnings growth, with some exceptions it does seem that the market has simply got more expensive.
At the risk of stating the obvious, prices go up when there are more buyers than sellers. If capital flows toward a market, then this has the effect of pushing prices up, and there are a few drivers that have perhaps helped this process. ‘Passive’ investing grew further in 2024, with data suggesting that it accounted for over half of US-domiciled assets under management, up from c20% in 2010. Passive investing involves investing into a basket of companies according to their weights in an index. Most stock market indices are value-weighted, such that the more valuable companies take up a bigger share of the index, and therefore a bigger share of incremental capital invested. This means that as more money flows into passive funds, all else being equal, they buy more of the more expensive companies and buy less of the less expensive companies. A perception of ‘US exceptionalism’ might help flows toward the country’s stock market and away from other global bourses. Should flows turn the other way the opposite could happen of course. As our market deconstruction above shows this can and does occur, but the tides can take a while to turn. Indexation (the process of investing according to a pre-defined benchmark) has long been namechecked as a reason for large market valuations to get larger and vice versa. Increasing ‘passivisation’ of investment is perhaps amplifying that dynamic.
There may be other changes in how people access and trade markets. CME Group is one of the main US derivatives exchanges, and indeed a holding in the fund thanks to its attractive economics backed by the network effects that drive traders to it. About 15-20% of their revenue comes from equity index derivatives trading, including on the S&P 500 and the Nasdaq 100. Derivatives allow investors to take on extra risk through leverage in the hope of extra reward. Therefore, more derivatives trading is an indication of more risk taking in the market. CME’s equity derivatives trading volumes in 2024 were double the level of 2019. Much of this has come from smaller, more accessible instruments that ‘normal’ people can participate in, rather than being limited to large financial institutions. The Covid-pandemic’s lockdown restrictions meant people were spending more time bored at home, and many decided to take up trading. Popular zero-commission trading platform Robinhood launched futures trading in October. In addition, speculation has become more short-term. In the last quarter of 2024, half of S&P 500 options trading volume came from people betting on same-day market movements, so-called ‘zero-day’ options, compared to less than 30% in 2020ix.
Geopolitics is likely playing its part as well, with the Trump administration newly installed and its tax-cutting, tariff-hiking and deregulatory agenda leaving people wondering what it will all mean for corporations around the world. So far market moves seem to be betting on the US equity market and business benefitting over others. We laid out how we see the potential effects of tariffs on the portfolio in our November Investment viewx, and we are as interested as anybody in what comes out of the White House in the coming weeks and months. In short, we think the portfolio is relatively well placed despite the balance of the portfolio being toward European listed businesses but will assess new news on its merits.
Does this market make sense?
The market looks expensive, and has some big companies in it, but it is at least conceivable that the valuations are justified in some way. Without wishing to sound too bearish, some alternative indicators suggest to us that this is unlikely.
The ratio of the total value of the US stock market to US GDPxi, also known as the ‘Buffett indicator,’ measures the difference between market values and real economic output. Higher levels indicate that investors are willing to pay more for the profits they receive, at an aggregate level. This ratio has increased to levels comparable to the dot-com bubble in 2000.
Market concentration, the opposite of risk-reducing diversification, is at levels not seen for decades; in December, the top 10 companies in the S&P 500 made up almost 40% of the index, compared to the last high of c25% in 2000. The top five made up 29% of the index, a level of concentration equivalent to the Nifty Fifty era in the late 1960s (this peaked at c18% in 2000). At the end of the year, Apple, NVIDIA, Microsoft, Amazon and Alphabet’s collective market value was $14.8 trillion, about half of US GDP. Ten years before, their collective market value was ten times smaller. They’ve undoubtedly grown in that time, but their market value has grown faster.
The valuation and risk concentration of the US stock market in 2024 is especially pertinent given that interest rates remain above the ultra-low post-financial crisis norm. The rate of return offered by US 10-year treasury bonds averaged about 4% in 2024 and as we write has increased towards 5%. The extra expected future return from equities compared to risk-free instruments like treasury bonds (excess returns) usually compensates investors for the extra risk they take, known as the ‘equity risk premium.’ In 2024 this premium declined to a very small number, an indicator that risks are out-weighing potential rewards at the overall market level.
All is not lost
At the global stock market level things are starting to look pretty expensive. Much is due to excitement around IT companies and AI, but there has been an upswing in more cyclical companies and the whole thing has been supercharged by the economic and geopolitical ramifications of the Trump presidency.
The analysis we’ve discussed in this investment view might not sound like a very good advertisement for investing in equities right now. At the level of the index that might be a sensible conclusion, but within the Evenlode Global Dividend portfolio we hope we’ve also shown that long term equity investing can (and in our view should) be about more than index headlines.
There are always great businesses to invest in at a decent valuation. In the late 1990s companies that did not have .com after their name or have products that obviously served the build out of the nascent global internet were lovingly, or not so lovingly, dubbed ‘old economy’ businesses. Investing selectively in these high-quality, durable compounders at the time, at the reasonable valuations on offer, would have resulted in a materially different outcome to the market over the soggy period between the beginning of the millennium and the onset of the zero-interest rate era. Much of Buffett’s fabled success was drawn from doing this.
In the out-turn the internet changed the world in many ways including, importantly, the media, but couldn’t remove real world human requirements to eat, drink, socialise in person, relieve sickness and clean homes. Business models changed to accommodate the new capabilities of the internet and new businesses emerged, but technology adoption takes time, and economics can put financial constraints on its build out. It also took some time for the equity market to get very excited about the possibilities and then over-correct when it transpired that there are limits to how fast things can grow.
It will take time for the current wave of new technologies to properly find their feet too, and we are sure that AI-related tools will. The emergence of the DeepSeek AI model is a reminder that new technologies evolve quickly, and their economics can change quickly too. The businesses in the portfolio will adopt them, and many already have, but they also have a core offering that is valuable to customers and generates profit, cash flow and dividends now that will grow into the future.
We will continue to invest in asset-light companies that are able to persistently churn out high returns on capital derived from strong economic moats and pricing power, while paying a sustainably growing dividend and reinvesting in themselves to benefit from their growing markets. As they generate their own resources, they can do this almost regardless of the valuation that the market ascribes to them. If this means we can continue to invest with confidence that market valuations make sense, as they do for the portfolio, then all the better for future returns.
Ben P and Rob S
28 January 2025
Evenlode has developed a Glossary to assist investors to better understand commonly used terms.
Please note, these views represent the opinions of the Evenlode Team as of 28 January 2025 and do not constitute investment advice. Where opinions are expressed, they are based on current market conditions, they may differ from those of other investment professionals and are subject to change without notice. This document is not intended as a recommendation to invest in any particular asset class, security, or strategy. The information provided is for illustrative purposes only and should not be relied upon as a recommendation to buy or sell securities. For full information on fund risks and costs and charges, please refer to the Key Information Documents, Annual & Interim Reports and the Prospectus, which are available on the Evenlode Investment Management website (https://evenlodeinvestment.com). Recent performance information is also shown on factsheets, also available on the website. Past performance is not a guide to future returns. The value of investments and any income will fluctuate (this may partly be the result of exchange rate fluctuations) and investors may not get back the full amount invested. Fund performance figures are shown inclusive of reinvested income and net of the ongoing charges and portfolio transaction costs unless otherwise stated. The figures do not reflect any entry charge paid by individual investors. Current forecasts provided for transparency purposes, are subject to change and are not guaranteed. Source: Evenlode Investment Management Limited authorised and regulated by the Financial Conduct Authority, No. 767844.
Market data is from S&P CapIQ, Bloomberg and FE Analytics unless otherwise stated.
ihttp://www.econ.yale.edu/~shiller/data.htm
ii Zooming out - May 2024
iii MSCI, 31 December 2024.
iv Free Cash Flow (FCF) - A measure of how much cash a company can generate over and above normal operating expenses and capital expenditure. The more FCF a company has, the more it can allocate to dividend payments and growth opportunities. FCF Yield is FCF per share divided by the current share price. A higher Free Cash Flow Yield implies a company is generating more cash that could be paid out as dividends and to reinvest into growth of the business. The Free Cash Flow Yield is the total free cash flow generated by a portfolio or index, divided by the market value of the companies in the portfolio or index.
vPrice return = share price change in 2024 in local currency. Profit used is calendar year adjusted operating income to assess underlying changes, data from Visible Alpha. The 4th calendar quarter of 2024 is based on consensus estimates. The earnings multiple used is market capitalisation divided by adjusted operating income.
vi Mean FERs for US and non-US listed companies in the Evenlode Global Income universe, as at 31 December 2023 and 2024.
vii Source: Bloomberg, Evenlode Investment.
viii PE ratio = Price/Earnings ratio. A measure of a company’s current market valuation compared to its earning potential, calculated by dividing a company’s share price by its Earnings per share (EPS). EPS is calculated by dividing a company’s profit by the number of shares in issue.
ix CBOE zero-day options trading volumes: https://www.bloomberg.com/news/articles/2025-01-03/zero-day-options-are-most-popular-on-s-p-500-as-dominance-grows
x Tariffs, trade and the not-quite-everything rally
xi GDP = Gross Domestic Product. A measure of the value added created through the production of goods and services in a country during a certain period. GDP is used to measure the economic health of a country.