July was another positive month for global stock markets. Share price volatility was high, but strong corporate earnings and the fall back in the oil price towards the end of the month were both helpful for investor sentiment.
The IFSL Evenlode Income fund has risen +5.4% year-to-datei. We have been in the thick of interim results season over the last month and have now heard from more than 85% of the portfolio and met with a plethora of management teams. Good fundamental growth is coming through, and several companies upgraded guidance for the year. The aggregate portfolio is forecast to grow earnings per share by at least +10% for the current year.
The new normal
An observation we have had over recent weeks is the degree to which companies (and customers) are getting used to the volatile operating backdrop of the last five years. Geopolitical uncertainty, input cost volatility and supply chain complexity are the new normal. This is not to say that companies are entirely immune from these shocks, but they are getting better at managing through these uncertainties – day-to-day life needs to carry on. This quote from Sage management on their recent trading update call, nicely illustrates this general mood (here CEO Steve Hare is describing the vibe amongst Sage’s mid-sized business customers):
‘The way I would see it at the moment is, whether it be the Ukraine conflict or whether it be the war in the Middle East, I think people are slightly looking through it now and saying, "It kind of is what it is. It'll come to an end in due course. In the meantime, I need to get on with things". If you link those two things together, obviously part of what we're selling is not just compliance - keeping you safe, et cetera - but it's also offering you productivity, it's offering you efficiency, it's offering you automation of your workflows. In some ways, the more people see those cost pressures, the more it encourages them to invest, to find productivity, to be able to absorb cost increases elsewhere. I would say, at the moment, in terms of the pipeline of interest, the engagement is strong and is largely unaffected by the ups and downs of the macro environment.’
A broad opportunity set
We have initiated three new positions, one in July, and two in the first week of August which we will disclose in due course. These have been funded by reductions in Rotork and Intertek, following their takeover approaches.
Overall, we are seeing a very broad range of opportunities across our universe of competitively advantaged, high return-on-capital, UK-listed companies - from UK-based global market leaders to domestic market leaders, from consumer-facing to business-to-business franchises, and across the market capitalisation spectrum. The portfolio’s free cash flowii valuation is as good as it was in the early days of the fund during the 2009-12 period.
This month, we will update on a range of holdings following market updates and conversations with management.
Rotork:
Takeover approach.
The board of Rotork announced in mid-July that they have reached agreement on the terms of a recommended cash offer from Swiss-based engineering firm ABB. The offer price represented a premium of approximately +73% to the undisturbed share price.
Rotork is a niche market leader that makes and services the specialist actuators and flow control equipment that open and close valves in industrial settings – from oil refineries to water treatment plants and pharmaceutical facilities. Rotork actuators have an exceptional reputation for quality and are mission-critical to the large industrial facilities into which they are installed but represent a very small proportion of overall build and running costs. As with the fund’s other niche industrial holdings, Rotork is well positioned for long-term structural investment trends in areas such as energy security, automation, electrification and infrastructure renewal.
The development was not a huge surprise to us - ABB publicly noted their desire to buy a niche actuator business at their capital markets day last autumn – and Rotork, as with many other UK-listed quality companies, has become incredibly cheap over recent years. Prior to the bid, it was trading at more than a 40% discount versus global peers.
The IFSL Evenlode Income portfolio and investable universe are full of companies that are trading close to the bottom of their long-term valuation ranges, and at significant discounts to their global (and particularly US) peers. The discount within the UK market versus the US – across sectors – is well demonstrated by the Barclays chart below:
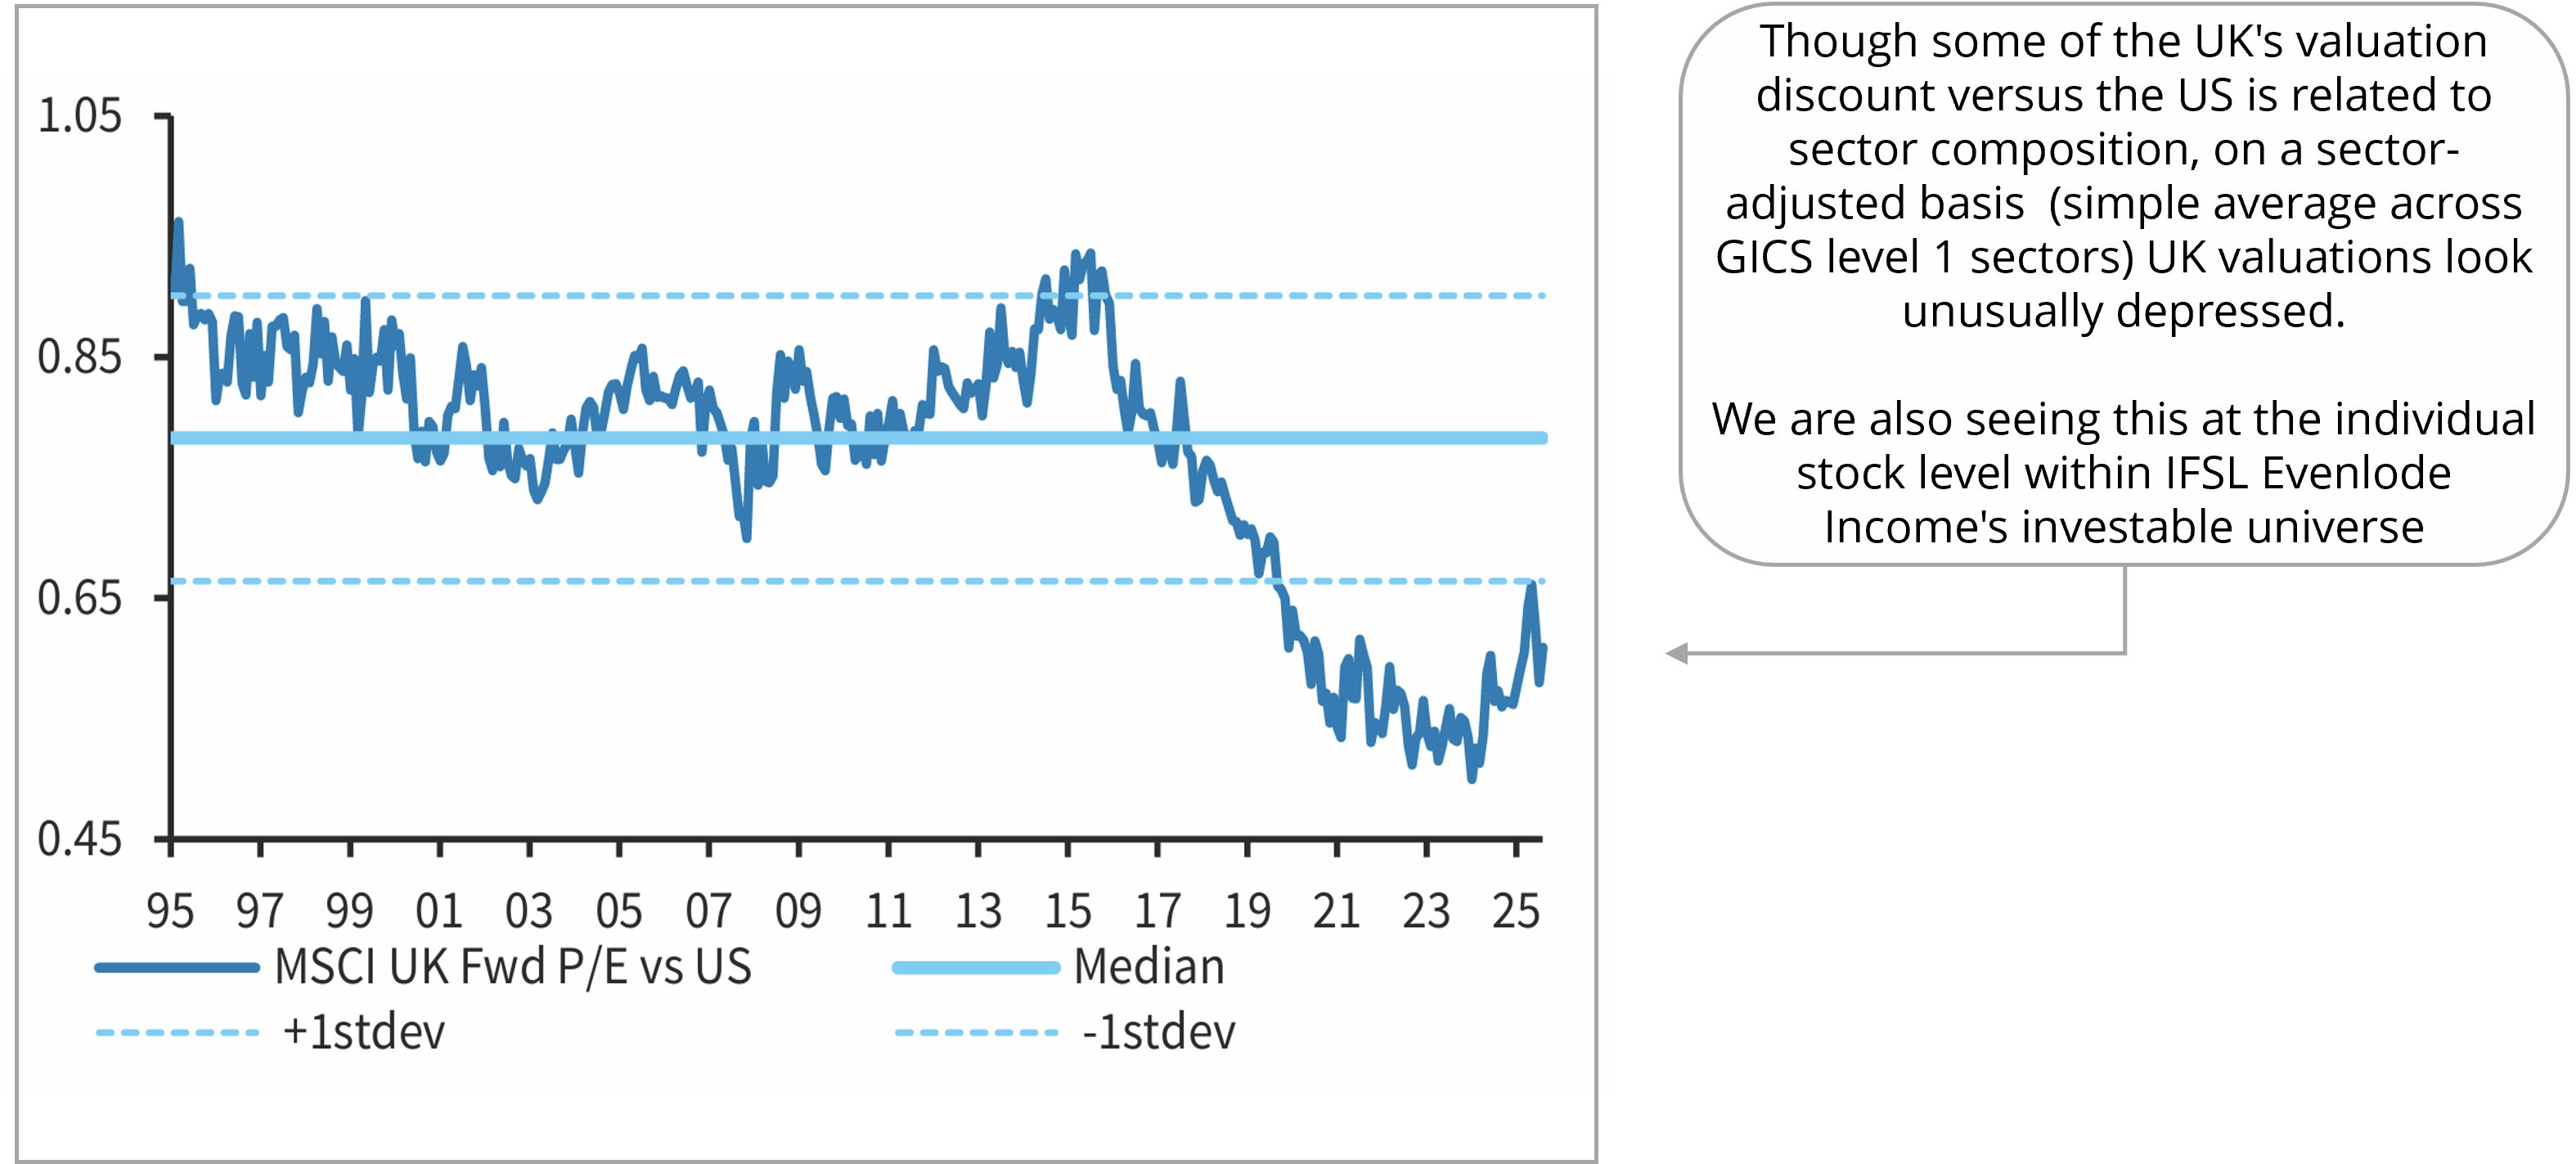
Source: Barclays Research, July 2026.
Experian:
Trading update – straight down the fairway.
Experian, the market-leading credit analytics company, kicked off the second quarter earnings season for IFSL Evenlode Income. It was a solid trading update, growing revenue +7% on an organic basis, or +10% including the positive impact of acquisitions and currency movements, with good growth across all main regions. This puts the company on track to deliver its full-year outlook for organic revenue growthiii of +6-8% and double-digit earnings per share growthiv.
Experian is a very high quality, deeply out of favour stock, trading at its cheapest level since the Great Financial Crisis (GFC) on a Price-to-Earnings (PE) multiplev of 16.5x and a 6% free cash flow yieldvi. Over the past year or so results have been solid but daily share price volatility has often been remarkably high. Our conversations with sell-side brokers and investment banks confirm our suspicions on a key cause of the unusually high day-by-day volatility over recent months. Basket trading of thematics – via Exchange-Traded-Funds (ETFs) – have become a big part of daily UK (and global) market flows, and Experian has found itself in several of the biggest ‘AI loser’ baskets in Europe. The choice of what goes into these baskets is not particularly scientific.
For us, this was yet another quarter demonstrating the formidable business Experian has become over the past decade, broadening its offering across new products and sectors, while generating very attractive returns, with a return on invested capital (ROIC)vii of more than 17% in its last financial year. As CFO Lloyd Pitchford highlighted at our recent meeting, the business grew revenue even during the worst year of the GFC, and in the subsequent 15+ years it has become even more resilient.
Experian has a deep economic moat – its core contributory credit data asset is extremely difficult to replicate, and it continues to layer more data sets on top. Meanwhile, the valuation is eye-wateringly attractive for the quality of the business. We strongly believe the market will reward our patience, and we think management are doing all the right things – clearly articulating the strategy and competitive position to investors, reinvesting for future growth and returning excess cash to shareholders. With the dividend and recently announced $1bn buyback, Experian will be returning over 5% of its market capitalisation to shareholders over the next 12 months.
Compass Group:
Double-digit earnings growth, underpinned by a dominant competitive position and structural outsourcing trends.
Compass, the global market leader in the food catering sector, released a third quarter trading update in July. Organic revenue growth was +7.2% for the first five months of the year and the company reiterated guidance for its financial year to September 2026 of at least +11% underlying operating profit growth (rather than earnings per share growth).
Growth remains a combination of volume, price and – importantly – net new business wins. Net new business wins have contributed +4-5% to Compass’s revenue growth for the last four consecutive years. Management expect a similar contribution both for 2026 and over the medium-term. The drivers of this net new business growth are two-fold. First, customer retention remains very high at 96%. Second, Compass continues to take a steady, incremental share of the global food catering market, thanks to both its dominant competitive position and the structural underpin of outsourcing. Compass’s procurement scale, multi-sector approach, and huge experience of navigating industry complexities in areas such as supply chain volatility, input cost inflation, digital infrastructure, regulation and health and safety, all play a part in their steady share gains within what is still a fragmented market. Roughly half of new business wins are also coming from first-time outsourcers. The outsourced portion of the global food catering market has typically been rising by approximately 0.5-1% per annum over many years, as customers realise that outsourcing reduces the hassle-factor, increases the quality of the offer, and saves significant cost.
The illustration below highlights both the strong overall market growth, and the opportunity for Compass to take steady share from both self-operated catering venues and smaller peers:
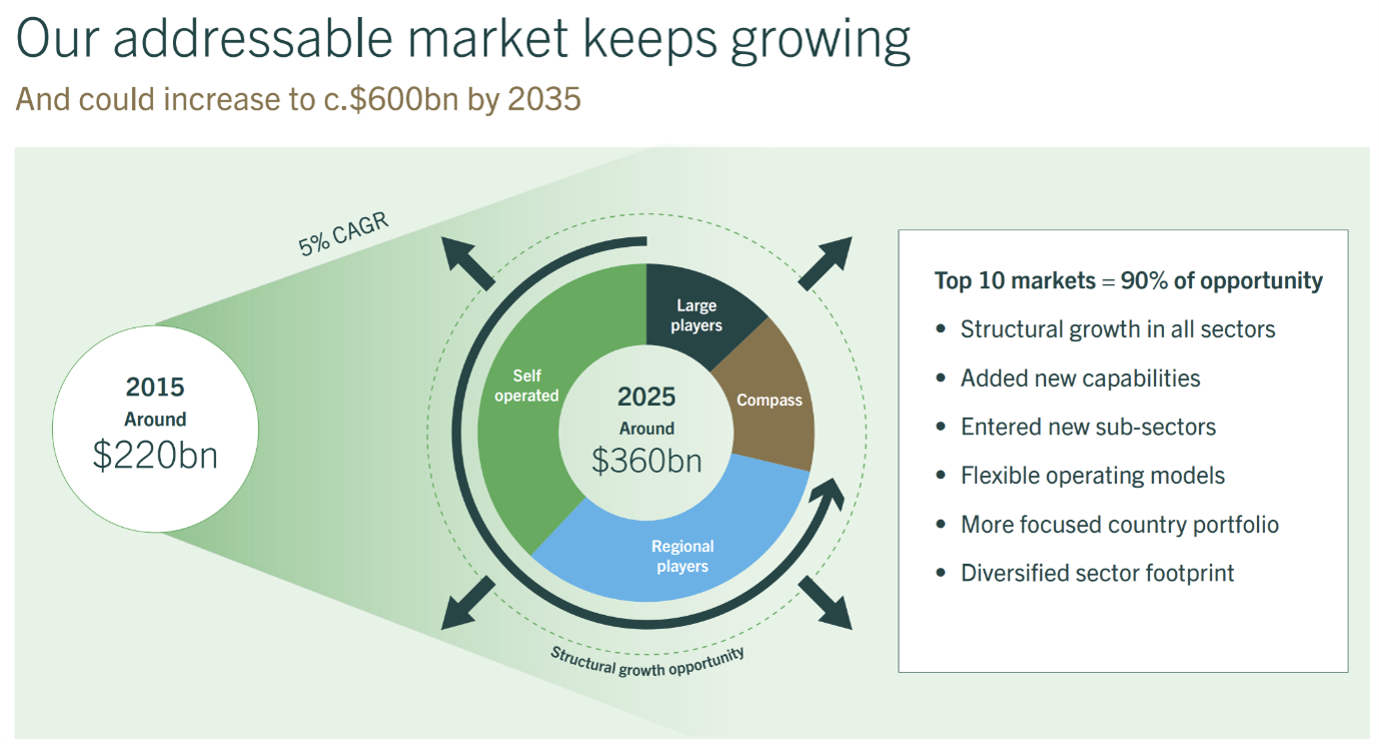
Source: Compass Group, May 2026.
Compass now provides food catering services to a very wide variety of sectors and customers – from Google, to hospitals, to remote oil rigs and defence facilities, and everything in-between. Compass was the biggest food and beverage provider for the recent World Cup, for instance. New business wins across the group grew in the latest quarter by +16% year-on-year. This is how management put it:
‘We are winning market share across multiple sectors, supported by the strongest pipeline of opportunities we have ever seen.’
The next-12-month PE multiple for Compass is 18.5x, the free cash flow yield is 4.6% and the dividend yieldviii is 2.7%. This valuation is close to the bottom of the stock’s range over the last decade. It also compares very favourably to its US-listed peer Aramark, despite Compass’s much more dominant market position. No valuation re-rating is required though for healthy total returns over coming years. The 2.7% dividend yield combined with strong earnings growth is enough for nicely double-digit fundamental returns. Following Compass’s bolt-on Vermaat acquisition last year, the company is paying down debt, but by the end of this year it will be back in the range at which share buy-backs and/or special dividends will become a regular option again.
Compass brings resilient qualities to the portfolio as a highly cash-generative, repeat-purchase business model. Earnings stability is not a factor that investors have been valuing of late. This is perhaps not surprising as there hasn’t been a meaningful global recession or credit downturn since the GFC, other than the brief Covid recession, which was short-circuited by both vaccine development and fiscal stimulus. It’s worth noting, though, that Compass’s profit (and share price) rose in both 2008 and 2009.
Howden Joinery:
Remains a coiled spring.
Howden Joinery released interim results, and we met with management following the results. Considering how tough the backdrop has been this year the results were very good. In a flat UK kitchen market, Howden grew underlying revenue by +3.7% (roughly half volume and half price) and earnings by +5.5%.
Management are in good spirits. The recent DIY Kitchens deal makes sense. Howden can add plenty of value to this business, which will be run as a standalone, separately branded business, albeit with plenty of opportunities for back-end and logistics synergies, and more general potential to leverage Howden’s platform and kitchen know-how. It is a complementary business to Howden, with no meaningful cross-over or cannibalisation risk in terms of the underlying customer demographic. Andrew Livingstone, Howden’s CEO (and former CEO of Screwfix) noted that DIY Kitchens reminds him of Screwfix in its early days. It has been growing revenue at +17% per annum over recent years and is a £250m business that could grow to become a £1bn business in time (and could grow to £500m without significant incremental investment). Check out the DIY Kitchens website and one of their showrooms – in either Yorkshire or Witney for now, but with roughly a new showroom a year to come – if you are interested in understanding the model in more detail.
In the existing Howden business, the vibes across the depot network and the trade builder community are also pretty good, despite the extremely challenging backdrop. As management said:
‘The market context is awful, but the vibes are OK – no different to the end of last year, despite the war. The product-line up and the cost base are in great shape, the team stability is as good as it’s been, and the lead-banks are full. Good builders are very busy.’
Though Howden has been growing over recent years, the company has been steadily de-rating. The shares are currently trading on a next-12-month PE multiple of 14.1x, a free cash flow yield of 6.5%, and a dividend yield of 3.1%. This is all whilst we bump along the bottom of the cycle and is also off a net cash balance sheet. If UK kitchen volumes normalised back to their long-term average over coming years, there is a very credible route to a doubling of earnings.
The company is very well invested, unlike their competitors who would not be in a position to cope with the volume upside. In this scenario, the incremental drop-through from revenue to profit would be significant.
Weir Group:
A growing installed base and cash generative aftermarket cash flow stream.
Weir is the global market leader in pump technologies for mineral processing and has a service hub within 200km of every major mine worldwide. Its model has attractive ‘razor-blade’ characteristics, with every pound of new equipment sold generating approximately 30 pence per annum of recurring, long-term aftermarket revenue, generated from the spares and consumables that customers purchase from Weir to support the daily operation of the installed base of mission-critical equipment. This repeat-purchase revenue has proven remarkably resilient across economic cycles and represents more than 80% of group sales (and more than 90% of profit due to its high gross margins).
Weir’s mining focus positions it to benefit from structurally growing demand for critical metals such as copper, nickel, lithium and cobalt, all essential for the global energy transition, infrastructure renewal, and reshoring of key manufacturing processes. Management targets mid-to-high single digit through-cycle organic revenue growth at attractive 20%+ profit margins, which is based primarily on supporting production from existing brownfield mines.
Weir released interim results last week. Our meeting with management after results confirmed order trends from brownfield expansion are positive, and greenfield investments will begin to come through over coming months, with particularly encouraging signs within the Latin American region. The company’s market share in its key Warman pump franchise is 50%, with win rates running at 70% - a reassuring indicator of the company’s attractive proposition. The stock’s forward free cash flow is 6.3% and the dividend yield is 1.8%.
RELX:
AI-driven revenue growth and operating leverage.
RELX reported very solid interim results in July. Underlying revenue was up +7%, operating profit up +9%, and earnings per share up +11%. The results were in-line with expectations and guidance was reiterated for the full year.
We continue to view RELX as an incremental beneficiary of generative AI. We won’t restate the reasons why here as we have written about them extensively in recent investment views, but these results are a clear demonstration that RELX’s front-footedness in harnessing generative AI technology is translating into tangible value for both RELX’s clients and financial results.
We view the most interesting and important point from results as the incremental AI-driven acceleration of underlying revenue growth in both its Science, Technical and Medical (STM) and Legal divisions. The debated areas within these divisions represent approximately 25% of operating profit and are where the biggest AI questions have been centred over recent months for RELX. The following table shows group and divisional underlying revenue growth for the full-year 2025, and also for the first half of 2026:
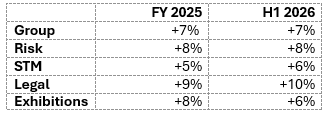
The acceleration in STM and Legal is a direct result of AI-driven growth, as clients renew their long-term contracts and pay more for value-added AI-driven functionality and usage.
Management see the growth opportunity from their AI-driven platforms in Legal and STM as a multi-year opportunity. In Legal, +10% divisional growth is now increasingly being driven by the Lexis Nexis Plus AI platform:
‘The step-up in growth continues to be driven by the continued roll-out and penetration of AI-tools. Roughly three quarters of the renewal value is now coming from the Lexis Nexis Plus AI platform. The number of institutional users is growing, the number of users within each institution is growing even faster, and the usage per user of the range of different tools is then growing faster still. We see the first conversion to the Lexis Nexis Plus AI platform as just the starting point of the growth opportunity.’
RELX has a very steady, subscription-based revenue profile, so it is not a business where growth acceleration would ever be rapid, but these indicators are all very positive for multi-year growth. Management stressed this multi-year opportunity at results, comparing it to the print-to-digital platform shift back in the 2000s and 2010s:
‘We keep upgrading and adding functionality. You have to look at the transition to Lexis Nexis Plus AI as almost analogous to the print-to-digital platform shift. Back then you had to transition customers from physical print to the basic digital platform in order to drive multi-year growth from increasingly sophisticated higher-value analytics services on that platform. In the same way, moving clients to the Lexis Nexis Plus AI platform is the first step to driving strong growth for many years to come.’
Within the STM division, RELX management are seeing similar AI adoption dynamics to Legal. The main difference is that decision-making and new technology adoption in the health care and academic sectors tends to be slower:
‘Growth acceleration in STM will come through more gradually, but there is the potential for the STM growth rate to increase gradually for very many years to come.’
They also noted the incremental efficiency gains across the group that are coming from AI, predominately in their software engineering teams – a point they have made to us frequently over the last year:
‘The gap between revenue and costs has become a little better as we have seen revenue acceleration, whilst also using generative AI to improve our efficiency. These trends will drive good margin expansion over time.’
RELX shares remain very attractively valued for the quality and growth profile - currently trading on a next-12-month PE multiple of 16x and free cash flow yield of 6.1%. Even with no re-rating of the stock, the combination of a 3% dividend yield and more than +10% earnings per share growth offers potential for comfortably double-digit fundamental total returns over coming years. If the stock were to re-rate back to, say, a 4% free cash flow yield, the shares would need to rise by more than +40% on top of this fundamental total return.
Unilever:
Interim results - Volume-driven growth acceleration and upgraded full-year guidance.
Unilever released first half results, with organic revenue up +4.8% for the first six months, and +5.8% over the most recent quarter - driven predominately by volume growth. As CEO Fernando Fernandez said:
‘Volume growth is our overriding priority. It is a true measure of demand, and an even more important signal of progress during times like this of heightened volatility.’
Emerging markets are more than 60% of sales and are now - along with the US - the engine of the business, delivering a broad-based +8.3% organic revenue growth in the second quarter. As the chart below shows, Unilever has been investing back into the business to improve execution and competitiveness over recent years, and it is paying off; volume growth in the second quarter was the best since 2010.
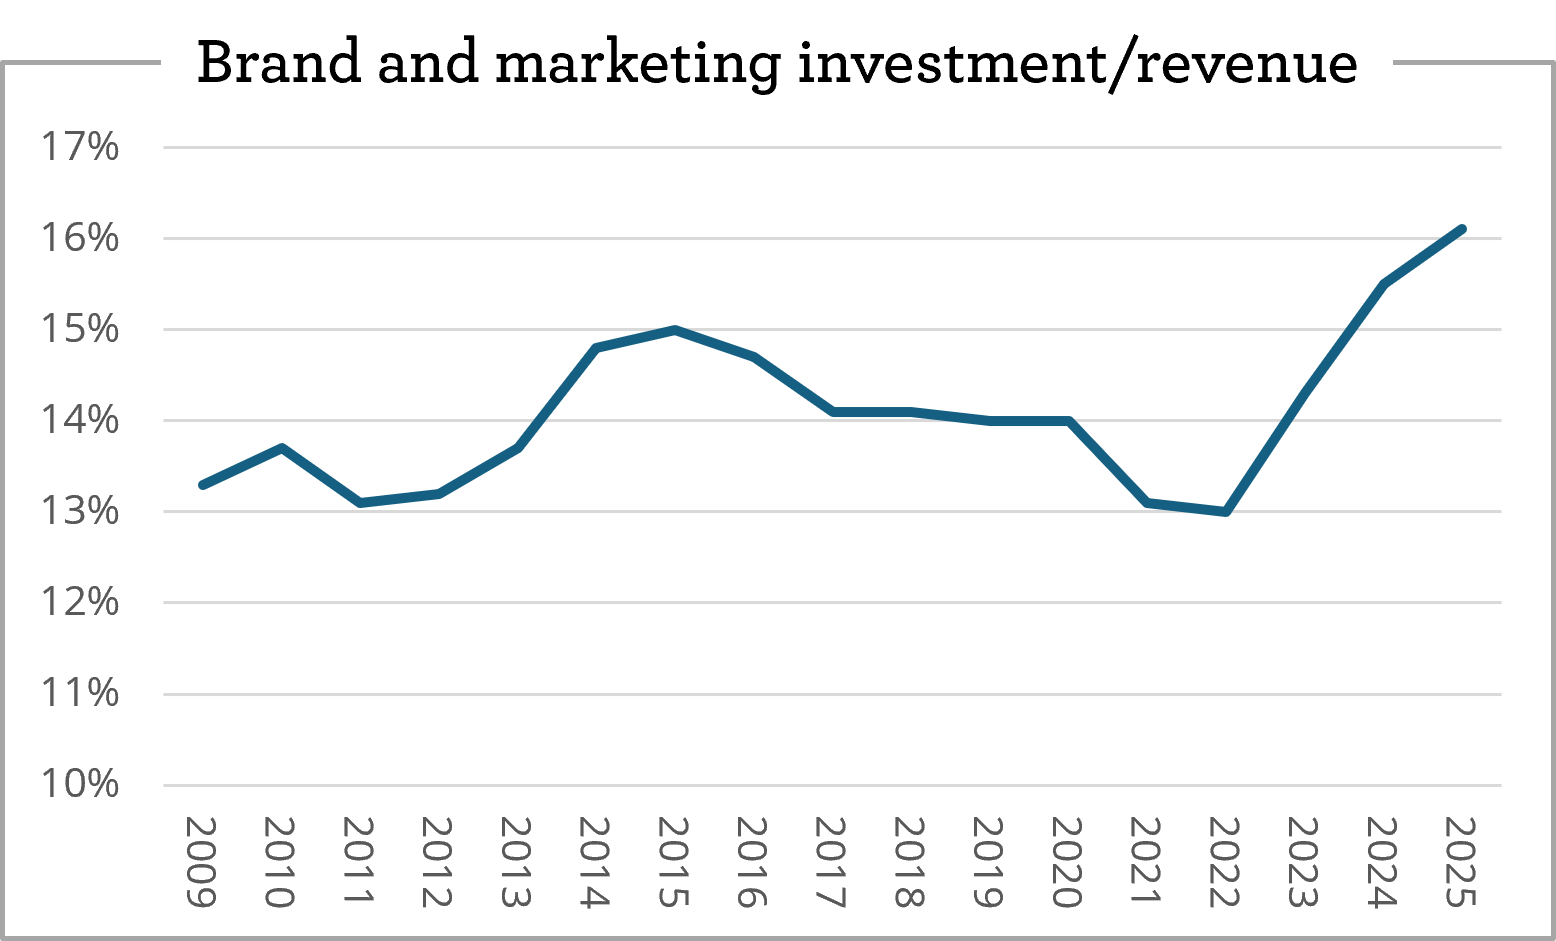
Source: Unilever, Evenlode.
Management upgraded organic revenue guidance for the full year to +4-6% growth and continues to expect modest margin expansion. They noted the degree to which they have become accustomed to managing the ‘new normal’ environment mentioned earlier in this piece, of supply chain complexity and volatile input cost inflation. Unilever has become a leaner machine and as a result is better equipped at coping with supply shocks than it was five years ago. Technology and data at scale have been helpful contributory tools in these efforts. Their upgraded 2026 guidance includes an assumption of oil prices hovering around $115 per barrel for the rest of the year.
The company is a well-invested, repeat-purchase business that has done a good job over the last decade at pivoting towards the Beauty, Personal Care, Wellbeing and Home Care categories. Unilever has a strong franchise in the US, and a dominant position in several key emerging markets. The opportunity for the company in the Indian beauty category alone, over the next decade or two, is massive (following the demerger of the food business, India will represent approximately 15% of group sales). It is hard to think of a more interesting long-term opportunity within the global consumer brand sub-categories than Indian beauty.
The stock, though, remains out of fashion. A forward PE multiple of approximately 16x (or more like 14x if one strips out the listed Hindustan Unilever and Unilever Indonesia stakes) is very modest for the quality of its market-leading brand portfolio, global scale and embedded distribution network. The free cash flow yield is 6.1% and the dividend yield is 3.7%.
Informa:
Championing the specialist.
Informa has been an IFSL Evenlode Income holding since 2014 (and United Business Media - which merged with Informa in the late 2010s - was a holding from just after launch in 2009).
Over the last decade, via a combination of bolt-on acquisitions and organic growth, Informa has built itself into the dominant global market leader in the trade exhibitions sector, holding a 15% share in a highly fragmented market. We view this industry as a highly attractive, niche sector. Informa describes itself as a ‘champion of the specialist’ owning brands from WasteExpo (the premier event for waste management and environmental services professionals!) to Cannes Lions.
The core of Informa’s economic moat is its two-sided network effect with well-established events dominating their respective niche industries. For exhibitors, the value of participating grows as more attendees register for top-tier events. The cost of a stand is low relative to overall market budgets, but the return-on-investment from the business done at and after a show often generates a return-on-investment of five times or more.
For attendees, the breadth and diversity of exhibitors provide a one-stop shop to meet a wide range of suppliers, creating a powerful flywheel effect which reinforces the value of Informa’s events year after year.
Informa’s model is also asset-light and highly cash generative. The company does not own the venues and typically receives payment in advance of the event as exhibitors look to secure premium space. Most revenue comes from exhibitors, which makes the business reasonably resilient during economic downturns, as it becomes more important to invest in sales and lead generation in tougher times. Though not immune, we were impressed with these businesses during the GFC downturn.
We met management this week. The company has done well to deal with the war-related challenges in the Middle East. Exhibitions in Saudi Arabia and Dubai that were unable to run earlier in the year, have been moved to the fourth quarter. The company expects to grow underlying earnings per share at more than +10% for the year.
We had an interesting discussion around ROIC. Whilst the acquisitive strategy has been the right approach over the last decade - to build a market leadership position - the focus is now pivoting to organic delivery, which should naturally lead to a high incremental ROIC over coming years. That bodes well for shareholder value creation.
Management expect +7% medium-term organic revenue growth for its main B2B Live Events division, with a variety of levers available to achieve this growth, including space expansion, geographical expansion, attendee ticketing, price and digital services. The company also has plenty of potential to make its central functions more efficient, not least thanks to increasing digitalisation and the utilisation of AI tools. This will help streamline back-office functions and, along with operational leverage, lead to positive margin expansion over time.
The valuation of the shares remains highly compelling. Informa trades on a free cash flow yield of 9.1% and a dividend yield of 2.9%. We are therefore supportive of the expansion of the buy-back from £250m to £350m at the interim results.
Clarkson:
Dominant market leader with huge long-term growth runway.
Back in the 2000s and early 2010s the two listed UK shipbrokers, Braemar and Clarkson, were considered as close peers and both traded on a similar market capitalisation. Over the last 20 years though, Clarkson has become the undisputed global market leader in the global ship-broking industry, having pulled away from all the competition in what remains a very fragmented industry. For context, Clarkson’s market capitalisation is now £1.5bn compared to Braemar’s £75m.
What has been the secret of Clarkson’s success? Four key reasons:
- The Plough-Back: The company has consistently invested through-cycle – both organically and through bolt-ons – and now enjoys a number one or two position across all of the verticals in global shipping. This is highly attractive for customers. As management put it: ‘if you are Shell, you’re moving LNG, crude oil, chemicals and offshore energy markets. We are number one in all of these markets. If you are a competitor and only doing crude oil you just aren’t as critical to Shell as we are.’ Broad market leadership also provides great diversification - each sub-category of shipping has its own mini cycles. Clarkson’s diversification helps smooth these cycles out somewhat making it easier to continue investing through thick and thin.
- Geographical expansion: 20 years ago, Clarkson was 85% UK and 15% overseas. Now the revenue mix has flipped to almost exactly the opposite.
- Data and research: Clarkson has become the go-to trusted source for data and research in the industry. – the MSCI World of the global shipping market. There are myriad ways that Clarkson is investing to monetise its position in data and research.
- Trustworthiness: Clarkson has been an industry leader in pushing compliance and regulatory standards increasingly high. This helps the company’s large corporate clients sleep at night - in a sector not without its share of less salubrious operators.
Clarkson management sees no ceiling in terms of its ability to continue to grow share across its verticals. Geopolitical complexity, and trends such as supply chain and energy security are also helpful for long-term growth potential. The company reported interim results this week, with revenue up +39%, earnings per share up +50% and guidance upgraded for the full year. The stock’s valuation remains attractive. The forward free cash flow yield is 6.9% and the dividend yield is 2.5%.
Hugh, Chris M., Ben P, Leon and the Evenlode team
7 August 2026
Important information
Evenlode has developed a Glossary to assist investors to better understand commonly used terms.
Market data is sourced from S&P Capital IQ, Financial Express Analytics and Bloomberg unless otherwise stated.
This document is not intended as a recommendation to invest in any particular asset class, security, or strategy. The information provided is for information purposes only and should not be relied upon as a recommendation to buy or sell securities. Prospective investors should seek independent financial advice.
This document has been produced by Evenlode Investment Management Limited (‘Evenlode’). Every effort is taken to ensure the accuracy of the data used in this document, but no warranties are given.
Investment commentary represents the opinions of the Evenlode team at the time of writing and does not constitute investment advice. Where opinions are expressed, they are based on current market conditions, may differ from those of other investment professionals and are subject to change without notice. Any forecasts provided are subject to change and are not guaranteed.
IFSL Evenlode Income is a sub-fund of the IFSL Evenlode Investment Funds ICVC. Full details of the Evenlode Funds, including risk warnings, are published in the IFSL Evenlode Investment Funds Prospectus and the IFSL Evenlode Investment Funds Key Investor Information Documents (KIIDs) which are available on request and at www.evenlodeinvestment.com.
The IFSL Evenlode Investment Funds are subject to normal stock market fluctuations and other risks inherent in such investments. The value of your investment and the income derived from it can go down as well as up, and you may not get back the money you invested. You should therefore regard your investment as long term.
The Evenlode philosophy and process creates a bias towards companies that meet our quantitative and qualitative requirements. As a result, the fund may have material differences in exposure in terms of style factors, industry sectors and geographies to the wider equities market and comparator benchmark. Over the short-term this may result in material underperformance in certain market conditions.
As a focused portfolio of between 30 and 50 investments, IFSL Evenlode Income may carry more risk than a fund spread over a larger number of stocks. The funds have the ability to invest in derivatives for the purposes of efficient portfolio management (techniques used by investment managers to manage a portfolio in a way that aims to improve returns, reduce risk, or manage costs, without significantly changing the overall investment strategy or risk profile), which may restrict gains in a rising market. Investments in overseas equities may be affected by changes in exchange rates, which could cause the value of your investment to increase or diminish.
Past financial performance is not a reliable indicator of future results. Fund performance figures are shown inclusive of any reinvested income and net of ongoing charges and portfolio transaction costs unless otherwise stated. The figures do not reflect any entry charge paid by individual investors. Tax treatment depends on individual circumstances and may change in the future.
Evenlode believes that delivering real, durable returns over the long term can be best achieved by integrating environmental, social and governance (ESG) factors into the risk management framework as this ensures that all long-term risks are monitored and managed on an ongoing basis. In addition to reviewing ESG factors when making investment decisions, Evenlode engages with portfolio companies on a range of ESG issues (for example greenhouse gas emission reduction). However, please note that the fund does not have a sustainability objective.
This document is neither directed to, nor intended for distribution or use by, any person or entity who is a citizen or resident of or located in any locality, state, country or jurisdiction where such distribution, publication, availability or use would be contrary to law or regulation. The sale of shares of the fund may be restricted in certain jurisdictions. In particular shares may not be offered or sold, directly or indirectly in the United States or to U.S. Persons, as is more fully described in the Fund's Prospectus.
FTSE® is a trademark of the relevant London Stock Exchange Group plc (“LSE Group”) companies and is used under licence. FTSE Russell is a trading name of certain LSE Group companies. All rights in FTSE Russell indices and data vest in the relevant LSE Group company. Neither LSE Group nor its licensors accept any liability for errors or omissions in the indices or data, and no reliance should be placed on this information. Redistribution of LSE Group data is prohibited without prior written consent. LSE Group does not promote, sponsor, or endorse the content of this communication.
Evenlode is a trading brand of Evenlode Investment Management Limited. Authorised and regulated by the Financial Conduct Authority, No. 767844. Investment Fund Services Limited (IFSL) is authorised and regulated by the Financial Conduct Authority, No. 464193.
Footnotes
-
Source: Financial Express. Total Return. B Inc shares.
31 December to 6 August. -
Free Cash Flow (FCF) - A measure of how much cash a company can generate over and above normal operating expenses and capital expenditure. The more FCF a company has, the more it can allocate to dividend payments and growth opportunities.
-
Organic Revenue Growth - The percentage increase of sales generated from a company’s existing resources and operations. Excludes growth attributable to mergers and acquisitions and foreign exchange.
-
Earnings Per Share (EPS) - A measure of company profitability, calculated by dividing a company’s profit by the number of shares in issue.
-
Price-to-Earnings multiple - A measure of a company’s current market valuation compared to its earning potential, calculated by dividing a company’s share price by its Earnings per share (EPS).
-
Free Cash Flow Yield – Free Cash Flow (FCF) per share divided by the current share price.
-
Return on Invested Capital (ROIC) - Calculated as net operating profit divided by invested capital. A measure of how effectively a company uses the money it has invested to generate profits.
-
Dividend Yield - Annual dividends made by a company to shareholders, expressed as a percentage of the share price.