Global stock markets rose in September, led once again by US-listed technology shares. The increasingly heated AI infrastructure investment boom has driven much of the growth in the US economy (and stock market) this year, whilst the rest of the global economy has been much more mixed. Consumers – particularly the lower income cohort – are making a slow recovery from the post-Covid cost-of-living squeeze, employment markets are muted, and industrial and business-to-business demand is strong in places but patchy in others. The Federal Reserve reduced rates in September, with further interest rate reductions from both the Bank of England and the Fed expected over coming months.
Performance
As I write, Evenlode UK Select is up +5.0% since its launch on 2 May, compared to a rise of +11.2% for the FTSE All-Share index.i
It’s clearly been a frustrating period for relative performance. The numbers have not been helped by some very strong performance from sectors in which the Evenlode UK Select portfolio has no exposure. Specifically, the following five areas have added more than +10% to the UK benchmark’s return since 2 May 2025: banks/insurers, defence, mining, telecoms/utilities and tobacco.
Interestingly, at the aggregate level, the UK stock market is expected to deliver flat net income growth this year, so the UK market’s return has all been driven by a valuation re-rating. The same applies over the last three years – no aggregate net income growth for the UK market but a return of approximately +50%.ii
In terms of stocks owned in Evenlode UK Select since launch, the strongest contributors year-to-date have been Spectris, Smith & Nephew and Smiths Group. The most negative contributors were LSEG, Diageo and RELX.
An interesting juncture
We think this a very interesting juncture for our approach. Stuck, in the context of the global stock market, between AI infrastructure plays on the one hand and bank/commodity/defence stocks on the other, the shares of many quality companies have become relatively unfashionable. Some have not been helped by post-Covid complications over the last three years (particularly for consumer-facing companies), whilst in 2025 tariff uncertainty and a weak dollar have also acted as a headwind to sentiment for holdings with US divisions.
Nevertheless, the Evenlode UK Select portfolio consists of a list of excellent, high-return, market-leading companies on an unusually attractive free cash flow yieldiii (currently standing at 5.6% and forecast to be 5.9% next year). Fundamental revenue and profit growth continues at a good pace, cash generation is very resilient, and long-term prospects are attractive.
The shares of these companies also represent stakes in productive assets that sell services and products which their customers place a high value on over time. In other words, they are real assets that are well positioned to protect long-run investors from inflation and currency depreciation.
In this investment view I’ll cover Evenlode UK Select’s top two holdings – Unilever and RELX - having met with both in September. In doing so I will also provide some perspective on the consumer brands and digital business models held in the fund. I’ll finish with latest thoughts on three of our newer positions – a diverse mix of market-leading cash generative companies.
Unilever
We have four repeat-purchase global consumer brand companies in the portfolio – Unilever, Diageo, Reckitt and L’Oréal – totalling approximately 17% of the fund. The consumer environment has been tough over the last eighteen months – particularly for younger and lower income consumers – which has led to share price underperformance, but these are enduring businesses, and valuations are at 15-year lows.
Unilever has seen a mixed backdrop during 2025. The business is strongly outperforming the tough US market thanks to stepped-up investment levels, whereas in Latin America (due to tariff uncertainty) and India (due to consumers waiting for end-September VAT-equivalent tax reductions to come into place) conditions have been softer. Unilever grew its organic salesiv by +3.4% in the first half of 2025 and expects +3-5% organic sales growth and profit margin expansion for the full year.
Looking to the longer-term investment case, we think there is much to like about the growth opportunity and the reinvestment levels that Unilever’s management are ploughing back into the business. As the following chart shows, investment in brand equity – both in absolute terms and as a percentage of sales – is running at multi-year highs. R & D and capital investment levels have followed similar trends.
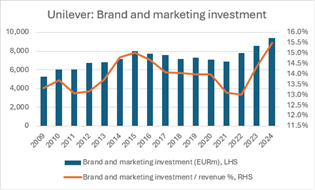
Source: Unilever.
The company is also becoming increasingly focused. Lower growth businesses have been disposed of over recent years (margarine, tea, ice cream etc.) and management are investing heavily behind the company’s key 24 geographies and 30 key ‘Power Brands’ (Dove, Vaseline etc.). These Power Brands now make up more than 75% of group sales and enjoy higher growth and profit margins than the group average. Many of these brands are in the attractive categories of beauty and personal care, which now generate half of Unilever’s total revenue and are likely to head towards two-thirds of sales in coming years. The growth prospects in the Indian beauty market alone - in which Unilever enjoys a very strong position - are huge.
Following the spin-off of its ice cream division in November, Unilever’s medium-term expectation is to deliver mid-single-digit revenue growth and a gradual improvement in profit margin.
For steady, resilient cash generative growth, and for one of the world’s great portfolios of brands, we think Unilever’s current valuation is extremely modest, with the current 3.7% dividend yieldv very well supported by a free cash flow yield of approximately 6%.
Undervalued quality
It is worth dwelling for a moment on how unloved the UK-listed consumer brand portfolios have become.
Unilever is back to a forward Price-to-Earnings (PE)vi multiple of 16x. This is the lowest valuation it has traded on since 2012. Stripping out the company’s shareholdings in stock-market listed Hindustan Unilever and Unilever Indonesia, the rest of the business is left trading on an even lower PE multiple of 14x. Similarly, Diageo resides on 13x and Reckitt on 15x – ratings which they haven’t traded on since the early 2010s.
RELX
The five information services companies held in the fund make up approximately 20% of the portfolio (RELX, Experian, Sage, LSEG and Wolters Kluwer). These are all distinct business models and operate in different verticalsvii. They all enjoy strong competitive advantages and are growing well. Their services are also mission-critical, highly embedded within customer workflows, represent a low proportion of customer’s overall spend, and are largely subscription-based in nature – all characteristics that lead to resilient, predictable cash generation.
Having benefited from a positive glow around AI adoption through much of 2023 and into 2024, their share prices have fallen back over the summer, as the stock-market narrative has switched from the opportunities that generative AI and agentic AI are bringing to these businesses, to the possibility of disruption risk.
Though not complacent, we think the economic moats of these businesses are wide and deep, and as long as they invest properly to embed generative AI and agentic AI into their customers workflows, growth opportunities remain very good as the world continues to digitise.
Here we look at RELX in more detail. The company grew organic revenue by +7% and earnings at +10% in the first half of 2025, and management expect growth to accelerate over coming years.
The chart below shows the journey RELX has made over the last 25 years, from a physical publishing company to a digital and data analytics company. Under the bonnet of the electronic revenue segment, there has also been a very significant shift from digital information to increasingly sophisticated data analytics, with RELX having been a leader in machine-learning and extractive AIviii for more than 15 years.
RELX Group - Revenue by format since 2000
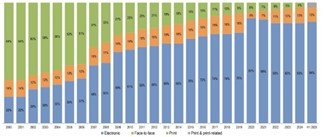
Source: RELX.
For RELX, the recent developments in generative AI and agentic AIix are most pertinent for its legal services business, LexisNexis, which represents about 20% of group sales. LexisNexis is the world’s largest legal database, containing over 100 billion documents with millions more added every day. It collects documents and data from more than 3,000 courts, including those that still only provide physical copies collected manually. This primary content is further enriched by editors and legal experts with commentary and insight, and fully indexed. These secondary annotations, layered on top of the public legal content, effectively create a fully proprietary dataset, which is highly trusted by law practitioners. As with the rest of the RELX group, LexisNexis has pursued a customer-led development strategy with a culture of continuous reinvestment over the years. Its data and – crucially – the data analytics services it builds around and on top of this data, have become very embedded in customers workflows as a result.
Taken together, we do not think it is realistic for an AI start-up to replicate RELX’s legal moat over the coming years, and conversations with major US law firms confirm that clients consider LexisNexis (along with its competitor Westlaw) to be in an extremely strong position. LexisNexis is also well ahead of the game in terms of its own agentic AI offerings, with its Protégé service launched commercially to clients in January with very positive feedback. This is leading to double-digit revenue uplifts from clients that upgrade to the full Protégé package, which assists lawyers with over 60 workflows.
You can see on the chart below the positive impact that the LexisNexis Plus AI platform and Protégé services have begun to have on the division’s organic growth rate over the last two years.
LexisNexis organic revenue growth - Last decade
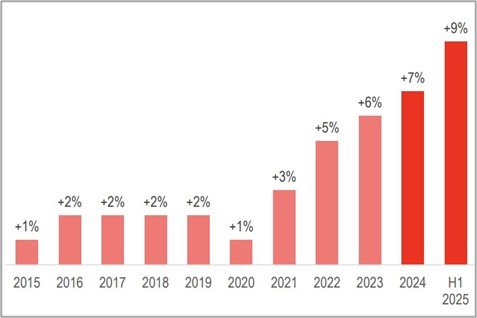
Source: RELX.
We met with Mike Walsh, the CEO of LexisNexis, at the end of September, and he sees the move into workflow tools such as Protégé as analogous to the way in which RELX many years ago - or Reed Elsevier as it was known back then - built the risk business out of a revenue line in its legal division of less than £50m, to the nearly £4bn business it is today. As the quote below highlights, he sees the opportunity to add value to their clients through agentic AI as a huge opportunity:
“If I look back on my career at LexisNexis, I’ve never seen a more exciting time and I’ve never seen a greater opportunity ... this is a multi-billion opportunity.”
RELX currently trades on a dividend yield of 2%, and a forward free cash flow yield of 4%.
Weir Group
To finish, I’ll discuss three relatively recent new additions, starting with Weir Group, which was previously a holding in the fund in the 2010s. We initiated the position in August using capital recycled from the fund’s holding in fellow engineer Spectris, which is now under a recommended takeover offer.
Weir is the global market leader in pump technologies for mineral processing, with the Warman-branded centrifugal slurry pumps a key part of its business – a deeply entrenched industry leader.
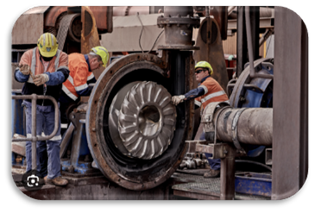
Weir sells mission-critical pieces of equipment that represent a small cost relative to the overall costs of operating a mining facility, but for which quality and reliability are crucial. Weir has a powerful 'razor-blade' type model. Each time £10,000 of equipment is put into a mine, Weir then generate an aftermarket stream of £3,000 per annum of spare parts and services – often for as long as 30 or 40 years, given both the life of a typical mine and how long the equipment lasts if it is well maintained. More than 90% of Weir’s profit is generated from this high gross margin aftermarket business. The installed base also has good potential to grow, underpinned by multiple growth drivers: infrastructure and defence renewal, the electrification of everything, precious metals demand and mining efficiency.
As shown in the following chart the aftermarket revenue gives a strong resilience to the free cash flow stream. Aftermarket revenues have grown at +7% per annum since 2011, including through the difficult global mining downturn of the 2010s.
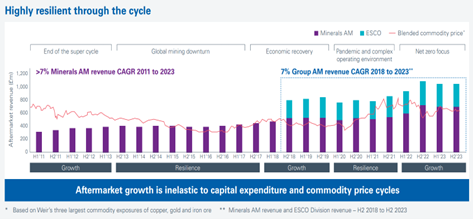
Source: Weir Group.
We purchased Weir on a dividend yield of 2% and a free cash flow yield of over 5%.
Intercontinental Hotels Group (IHG)
IHG shares saw a decline of more than a third in the share price earlier in the year which de-rated the shares from a PE multiple of 28x to 19x. Like Weir, this is a business the Evenlode Income fund held during the 2010s and we have returned to again in the strategy – more interesting diversification for the portfolio.
IHG is a top three hotel group globally, has fantastic economics and an improving competitive position. The combination of its 19 global brands, scale advantages and sticky guest loyalty programme drives strong revenue and margins for hotel owners, particularly compared to independents and smaller chains. It operates a capital-light franchise model with very high operating margins of approximately 50%. IHG has strong positions in developing markets like India, the Middle East and South-East Asia, where hotel penetration and leisure spending are set to grow strongly in coming decades. Its more mature markets, including the US, also continue to grow and IHG is consistently winning market share.
We met with management last week. Revenue growth is a little lower than normal this year because consumer confidence has been weak in the US, but the company is still on track for double-digit earnings growth this year, and mid-term guidance is for +12-15% per annum earnings growth.
IHG was purchased on a dividend yield of 2% and a free cash flow yield of over 4%.
Auto Trader Group
Auto Trader is a classic network effectx business, added to the Evenlode Income strategy in the Liberation-dayxi sell-off earlier this year. Over 75% of all time spent on automotive classified sites in the UK occurs on Auto Trader. Dealers typically achieve an 8x return on investment on the money they spend on Auto Trader, and the company continues to invest heavily in product development, which is further driving the value-add it can provide to dealerships. Its DealBuilder product, for instance - which is in the process of being rolled out - enables online reservations, part-exchange, finance, and delivery to be booked online.
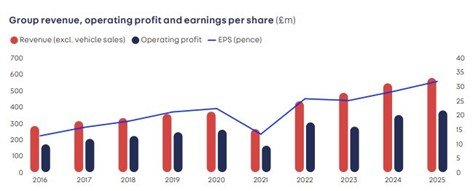
Source: Auto Trader
EPS - RH axis; Revenue and profit: LH axis.
As the chart above shows, the company has grown at a high single digit organic rate since its IPO in 2015, with consistently high returns on capital, a very low capital intensity, and a net cash balance sheet.
We purchased Auto Trader on a dividend yield of 1.5% and a free cash flow yield of 5%.
Hugh, Chris M., Ben P., Charlotte, Leon and the Evenlode team
10 October 2025
Evenlode has developed a Glossary to assist investors to better understand commonly used terms.
Please note, these views represent the opinions of the Evenlode Team as of 10 October 2025 and do not constitute investment advice. Where opinions are expressed, they are based on current market conditions, they may differ from those of other investment professionals and are subject to change without notice. This document is not intended as a recommendation to invest in any particular asset class, security, or strategy. The information provided is for illustrative purposes only and should not be relied upon as a recommendation to buy or sell securities. For full information on fund risks and costs and charges, please refer to the Key Investor Documents, Annual & Interim Reports and the Prospectus, which are available on the Evenlode Investment Management website (https://evenlodeinvestment.com). Recent performance information is also shown on factsheets, also available on the website. Past performance is not a guide to future returns. The value of investments and any income will fluctuate (this may partly be the result of exchange rate fluctuations) and investors may not get back the full amount invested. Fund performance figures are shown inclusive of reinvested income and net of the ongoing charges and portfolio transaction costs unless otherwise stated. The figures do not reflect any entry charge paid by individual investors. Current forecasts provided for transparency purposes, are subject to change and are not guaranteed. Source: Evenlode Investment Management Limited, authorised and regulated by the Financial Conduct Authority, No. 767844.
Market data is from S&P CapIQ, Bloomberg and FE Analytics unless otherwise stated.
Footnotes
-
Source – Financial Express. 2 May 2025 to 10 October 2025. Bid to bid, Total return basis, GBP Terms. Evenlode UK Select I Acc shares.
-
Source: Berenberg, 7 October 2025.
-
Free Cash Flow (FCF) - A measure of how much cash a company can generate over and above normal operating expenses and capital expenditure. The more FCF a company has, the more it can allocate to dividend payments and growth opportunities. FCF yield is FCF per share divided by the current share price. A higher Free Cash Flow Yield implies a company is generating more cash that could be paid out as dividends and to reinvest into growth of the business.
-
Organic sales growth – Excludes growth attributable to mergers and acquisitions and foreign exchange.
-
Dividend yield - Calculated by dividing the dividend per share by the current share price.
-
Price Earnings (PE) ratio - A measure of a company’s current market valuation compared to its earning potential, calculated by dividing a company’s share price by its Earnings per share (EPS).
-
Verticals – Specific segments or categories within a broader industry sector.
-
Extractive AI (Artificial Intelligence) – Pulls out relevant information from existing data.
-
Generative AI – Creates new content (text, images, code, music, video)
Agentic AI – Acts like a digital assistant to make decisions and take actions (combines extractive and generative AI with a level of autonomy). -
Network effect – Where the value of a product or service increases when the number of people using it increases.
-
Liberation Day – 2 April 2025, when the U.S. government announced a major shift in trade policy by introducing reciprocal tariffs on imported goods.