The commentary below applies to both the Evenlode Global Dividend and Evenlode Global Income portfolios. Market data is from Factset and FE Analytics, corporate valuation analysis from ourselves at Evenlode.
In last month’s investment view we discussed some of the portfolio changes we have been making, some for fundamental reasons of a change in our view of a business’ prospects, and some in response to the changing valuations on offer in the market.
The question of valuation and market levels has become a hot topic as equity markets have been on an upward march. Despite a pretty big wobble a little over a year ago, global equities have provided pretty solid returns over the last few years. Even since the start of the global pandemic, in February 2020, the MSCI World index has returned 29.6% in dollar terms and 21.0% in sterling.
As investors of our clients’ capital, we are concerned with both the qualities of the businesses that we hold and the valuations at which we own them. We always have one eye on the price that we are being offered and the investment opportunities available. We will focus on the valuation part of the process here, not forgetting that all of the businesses that make it into our investable universe exhibit the qualities of being cash generative, delivering high returns on invested capital, and good reasons why we expect those characteristics to persist into the future.
Long term value
We value all of the businesses that make it into our investable universe (the universe is the list of companies that we have researched and we deem to fit with the Evenlode process). The way we value companies is to use a return on invested capital model to estimate the long run of free cash flows that we might expect the business to be able to deliver, stretching out over many decades. The reason for using a model like this is that we are aiming to capture the economic characteristics of the business across the time over which we might own it, which is a long time all other things being equal. As shareholders, economically speaking it is ultimately the multi-year stream of profits and cash flows that the company delivers that one benefits from.
Using a model like this is beneficial in assessing the relative attractiveness of the stock prices of different companies at any given time, but it does have difficulties and drawbacks. The most important one is that it is impossible to know exactly what the future holds for these businesses. So it is vital (to our minds at least) to acknowledge that any valuation model is at best an estimate. We view the valuation endeavour as guiding us towards better opportunity, and away from increased valuation risk, rather than trying to set a very precise share price target.
With that said, our valuation discipline does give us a view on how attractive equity valuations appear at any given time. The specific measure we use is something we call the Forward Cash Return, or FCR, which is a type of discount rate and akin to the redemption yield on a bond. We’re happy to talk through this idea in detail with any interested readers, but for the current discussion it’s enough to know that the higher it is the better value we see.
Currently the FCR for the Evenlode Global Income/Dividend portfolio is 8%, adjusted for inflation. This is, broadly speaking, a proxy for what we might realistically expect the portfolio to be able to deliver in real returns per annum over the long term, with the very important caveat that we do not know what will happen and can’t guarantee returns.
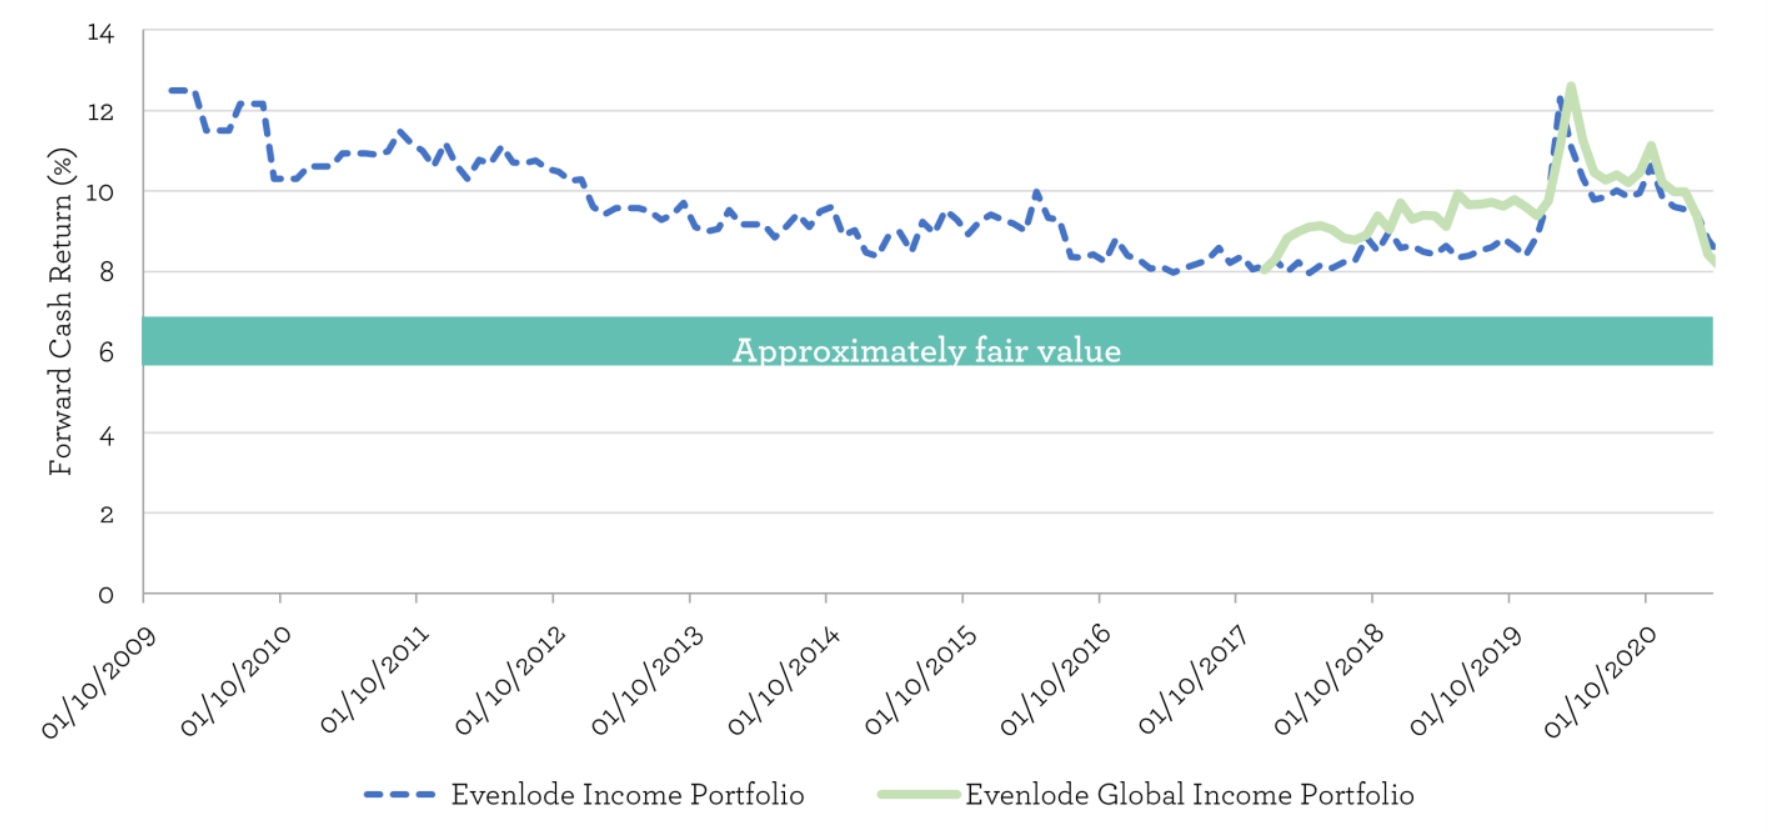
In isolation that 8% forward cash return number does not provide a view of on whether the portfolio is offering good or poor value, cheap or expensive. However, there are a couple of helpful reference points. The first is the long-term returns from the equity market. That would give us a measure of the ‘fair’ value of equities against which we can compare the forward cash return. Depending on where one looks and over what time period1, real returns of around 5-7% per annum are a what’s reported for equities. 8% for the portfolio is superior to this band, so the portfolio valuation seems to be attractive compared to historic equity market returns.
Second, we can look at that 8% FCR figure relative to our own history. The Evenlode Global Income/Dividend portfolio has been running for about three and a half years, but we have been managing the Evenlode Income fund since 2009 and so we can use our calculations on that portfolio as another reference point. The chart below shows the Forward Cash Return for the Evenlode Income and Global Income portfolios over that time.

The Evenlode Income fund began life during the great financial crisis of the of the late noughties. Since then equities have forged upward, helped by economic recovery but also, if our analysis is broadly correct, playing catch up with the very attractive valuations available at that time. This is reflected in the Forward Cash Return falling through the course of the last decade. By the time we launched the Evenlode Global Income fund, the portfolios had an 8% FCR, the same as we find ourselves at today. A lot has happened over the last three and a half years, the most significant event evidenced by the spike in forward returns last year as the market fell significantly at the start of the pandemic, then the market’s bounce and the reversal in forward return potential.
We have been able to maintain the valuation appeal of the portfolio at ‘better than fair value’ despite the upward movement of equity prices. Whilst there have been periods of time over the course of the last decade where valuations have been cheaper, what’s on offer right now still has the potential to deliver good outcomes for patient investors. Ignoring last year’s blip, the FCR remains within the band of 8-10%, as it has over the last five years or so.
What about the market?
The discussion so far has been about the portfolios we manage. This is where our focus is, on individual companies and their construction into sensibly diversified, attractively valued portfolios. However, the market backdrop is where we get to manage risk and opportunity and shouldn’t be ignored.
We do estimate a forward cash return measure for the global equity market to give ourselves another fiduciary marker of value. However, we are hesitant to put that number in black and white because of the very bold assumptions that one has to make to estimate it. Valuation models should be treated with caution and suspicion – this is one of the reasons we have built our own, so that we can critically assess its assumptions and inner workings. There are other indicators that we use though to sense-check our models.
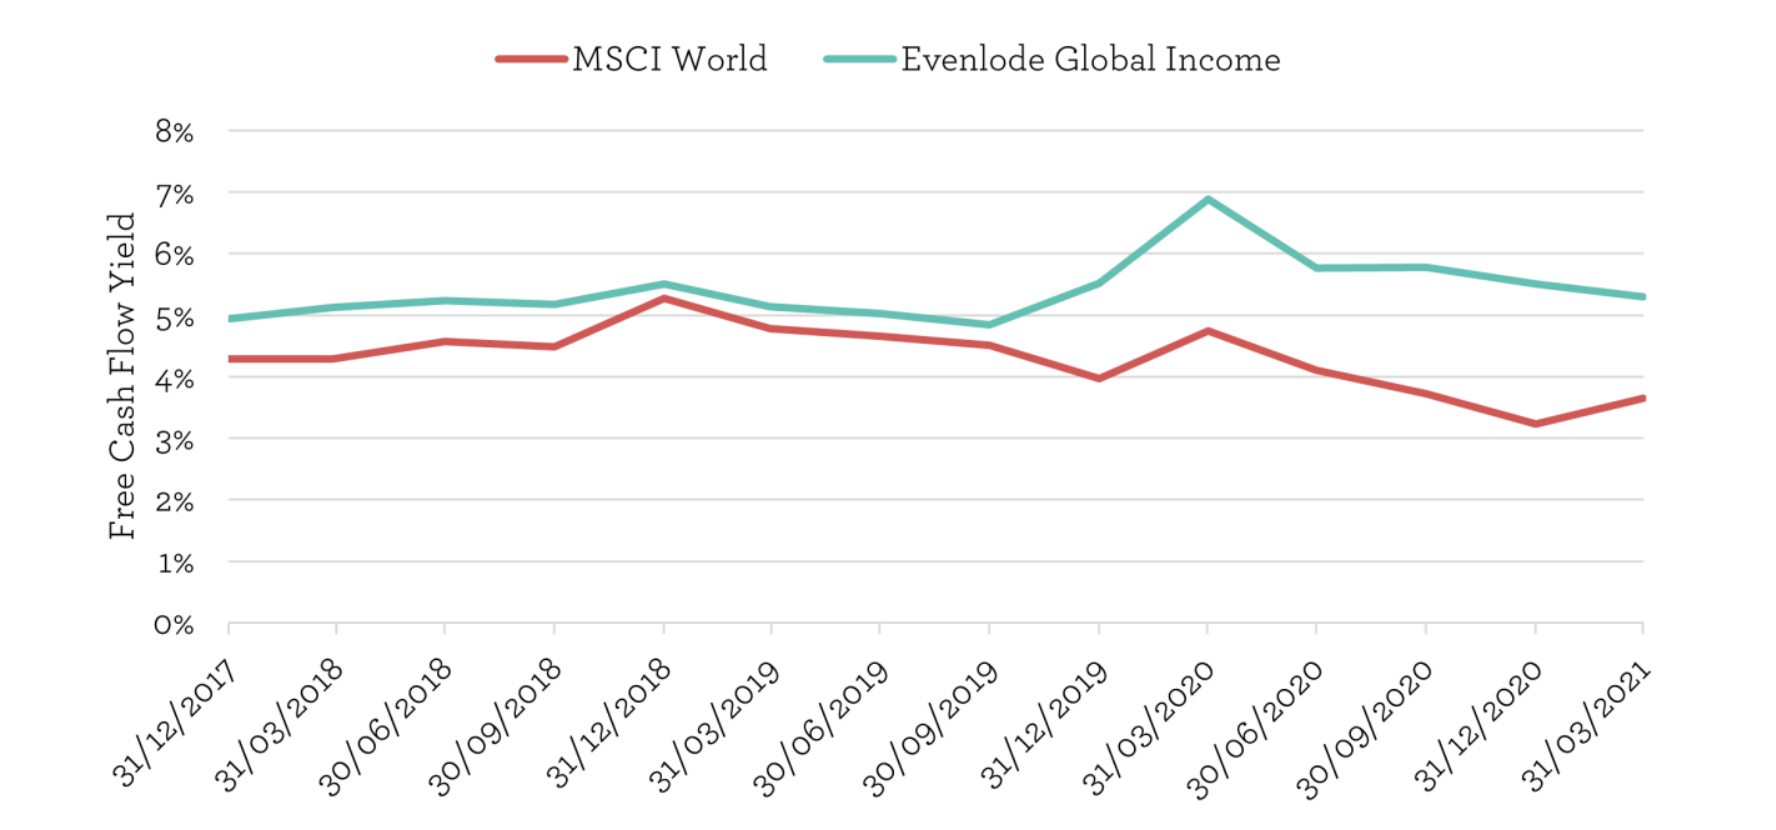
Another measure is to look at the price of the market relative to the free cash flow that companies are generating. This has the benefit of being relatively simple to calculate, but suffers from the issue we are trying to avoid with our valuation model – it only measures valuation based on one year of financial performance. Nonetheless, we can look at what has happened to the figure to provide a bit of market context.

The chart above shows the historic free cash flow yield for the MSCI World index and for the Evenlode Global Income/Dividend portfolio over the life of the fund. We can see that the portfolio had a small premium to the index in free cash flow yield terms, i.e. appeared to be slightly better value, until the pandemic came along since when things have diverged. As valuation-conscious investors we would usually expect to have a premium free cash flow yield. For reference, since 2009 the MSCI World’s average free cash flow yield has been 4.7%, and recent times mark the lowest figures since then.
Rising prices and low yields might make us wonder if the market is overvalued, and this certainly seems to be on the minds of many market commentators at the moment. Cash flows will probably rise as and when we emerge from the worst of the pandemic’s economic effects, reversing the falls experienced last year. That would close the free cash flow yield gap to our portfolio, for which cash flows have been resilient, and bring the figure somewhere closer to the historic average. So perhaps the apparent overvaluation isn’t quite what it seems at first.
Conversely, there are companies that now have very low cash flow yields, notably but not exclusively in the information technology sector, where a lot of growth is going to have to be experienced to let the yield grow into the market valuation. That growth is indeed proceeding quickly in many cases, but is not guaranteed. If it doesn’t come through in the magnitude expected then market valuations would adjust accordingly. To be clear, a low free cash flow yield does not equate to overvaluation. This is one of the reasons we favour using a valuation model over one year metrics like yields or price earnings ratios, but they can provide a starting point for considering what a company needs to do in order to meet the expectations of its valuation.
What does it all mean?
There are lots of theories as to why equity market values might look high. Chief among them are low interest rates pushing investors into equities to seek returns, and governmental stimulus putting cash in the pockets of people willing to have a punt on stocks (especially in the US). We find this sort of question interesting, but as interesting a question as it is, it is not information we use to make decisions.
We construct portfolios with the aim of managing both quality and valuation and the market delivers the valuation part by quoting a number at which we can buy and sell. We cannot control that price, and trying to figure out whether that price will go higher or lower in the short run is difficult, but we can control whether we choose to accept the price or not. And we can restrict the set of businesses that we consider to those that are the highest quality.
We seek out and like the resilient, repeat purchase, cash generative nature of the companies that we invest in, and the valuation data points we’ve discussed above show that the businesses are trading, in our estimation, at attractive levels in absolute terms, and relative to the overall equity market. This is what the market analysis means to us.
At the current time, our holdings in the consumer goods and healthcare sectors look particularly comfortable from a valuation point of view in absolute terms, and relatively speaking as they have underperformed the broader market. Some service and technology companies are also attractive.
Given the market volatility over the last 18 months we have had to be active in making sure that balance of quality and valuation risk management continues to make sense for the overall portfolio. That has meant some slightly elevated turnover compared to our history, but sometimes that is necessary. We hope for calmer times ahead but remain open to the valuation opportunities that might present themselves in the future.
Ben Peters, Chris Elliott and the Evenlode Team
28 May 2021
Please note, these views represent the opinions of the Evenlode Team as of 28 May 2021 and do not constitute investment advice.
Past performance is not a reliable indicator of future results. The value of investments can go down as well as up, and investors may not get back the money they invested. Current forecasts provided for transparency purposes, are subject to change and are not guaranteed.