Happy new year to all of our co-investors and readers. 2021 surely can’t turn out to be more dramatic than 2020 can it?
We’re giving it a pretty good go so far. We have two new highly transmissible strains of SARS-CoV 2 to deal with, the associated re-locking down of economies, travel bans, and to top it off the surreal and troubling scenes at the US Capitol Building. And we’re not even half-way through January. In response, the equity market has continued the vacillations of the prior year, with investors reappraising the returns on offer from disparate companies that experienced startlingly varied fortunes over the past 12 months.
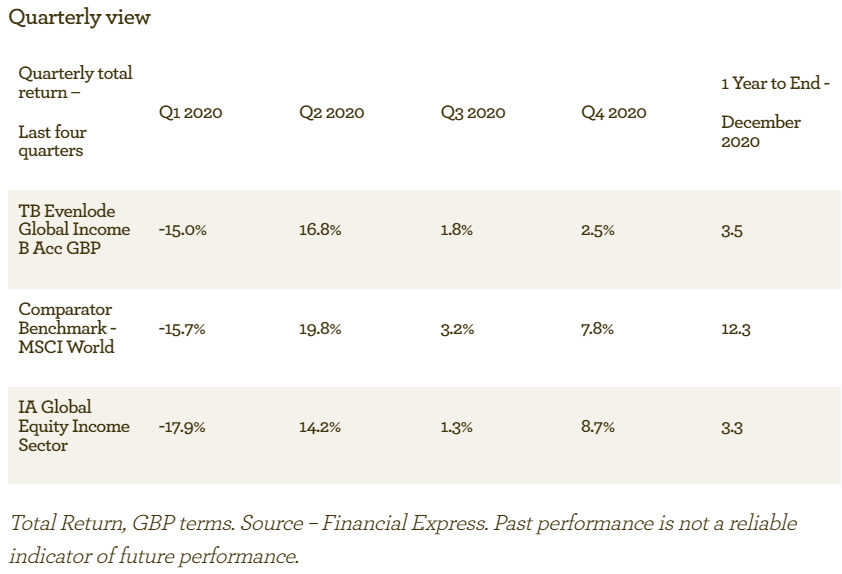
Before we get into a breakdown of your fund’s performance, we’ll have a look at this market context in a bit more detail. In headline, the portfolio ended the year returning 3.5% in sterling terms over the 12-month period. That puts it very slightly ahead of the average fund in its sector of funds with global income strategies, but quite some distance behind its benchmark, the MSCI World index, which returned 12.3%.
2020 – Year of the outlier
Last year was peculiar in many ways, but narrowing our focus to equity returns we see an increase in the dispersion of returns in the market. That’s not particularly surprising; in times of turmoil inter-stock volatility tends to rise as the market tries to sort out the winners from the losers, and 2020 was undoubtedly tumultuous. A more interesting observation is to dissect what caused the market’s impressive positive return, seemingly against the economic gods. In sum, the answer is outliers. Here we’ll look at some of the highlights from the MSCI World index. All data is from Factset, with total returns in sterling.
Naturally the market had some winners and losers as in any year, but the winners won big and the losers really went the extra mile. Perhaps cruise operator carnival and aircraft maker Bombardier can be forgiven for their share prices being down 71% and 77% respectively given the circumstances, but fraud-struck payments firm Wirecard can’t blame a virus for its 99% decline.
On the side of positive returns things were no less dramatic, with the star prize going to Tesla, up 717% on the year. Sometimes companies with good fortune strike gold and their valuation multiplies, but usually they’re quite small. Tesla is not small in market capitalisation terms; it makes up 1.2% of the MSCI World index at the current time and contributed fully one percentage point of the benchmark’s return all by itself last year. Whilst Wirecard made a good go at subtracting itself from the index in its entirety, it only detracted by -0.04 points.
If you’ll forgive the secondary school-level statistical exposition, here are the constituents of the MSCI World’s total returns for 2020 depicted on a box & whisker diagram[i]:
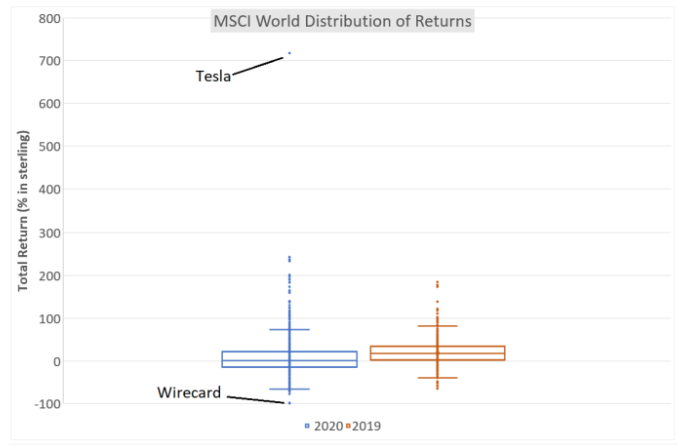
We’ve plotted 2019’s returns by way of comparison. The diagram depicts the greater dispersion of returns in 2020 over 2019 (evidenced by more ‘outliers’), which was a year of strong returns itself with the MSCI World index up in the mid-twenties. The positive skew of returns last year can also be seen, but there are some stats that show the super-normal pull of those big returners in 2020.
First, whilst the market index returned 12.3% in sterling terms, the mean (i.e. unweighted for market capitalisation) return in the market was 6.1% and the median just 1.3%. This shows not just the positive skew of returns but also the significant 'Tesla effect'. Big companies were the ones making the big returns.
A data point that exemplifies the effect is to count the number of companies that one needed to invest in at their respective index weights to capture the return of the market, if one were fortunate enough to select just the most positive contributors. Last year just 47 of the index's 1,1775 companies would have done the trick (with the rest of the market returning zero in aggregate). In 2019, it would have taken 804 positions. The market return was bigger in 2019, but this difference is material and represents a dense concentration of returns.
How concentrated were the returns? To get a sense, asking the same question but only seeking to capture half of the index return, in 2020 just four companies would have done it for you: Apple, Amazon, Microsoft and Tesla. In 2019 it would have taken 85 companies.
Microsoft’s total return was ‘only’ 37%, puny compared to Tesla but it’s a very big company (market capitalisation $1.7tn, a full 3% of the index) and it was very comfortably ahead of the average. It contributed 1.3 points of the market return.
Why are we spending time on this game of equity market Trivial Pursuit? In part it’s just interesting (at least, we find it interesting). The four companies accounting for half the market return are big technology-driven companies, a sign of the times perhaps. Tesla is a fascinating business, is it just a car company, or is it something much more? The market is erring toward the latter.
But more importantly the MSCI World index is our performance benchmark, and the portfolio we manage on your behalf lagged it significantly over the last year. Understanding the ebbs and flows in part explains why and helps contextualise the portfolio’s performance. Let us now turn the lens on the portfolio itself.
Finding the middle ground
We shouldn’t subject the market to an analysis that we wouldn’t put ourselves through, so here is a similar depiction of returns from the Evenlode Global Income strategy:
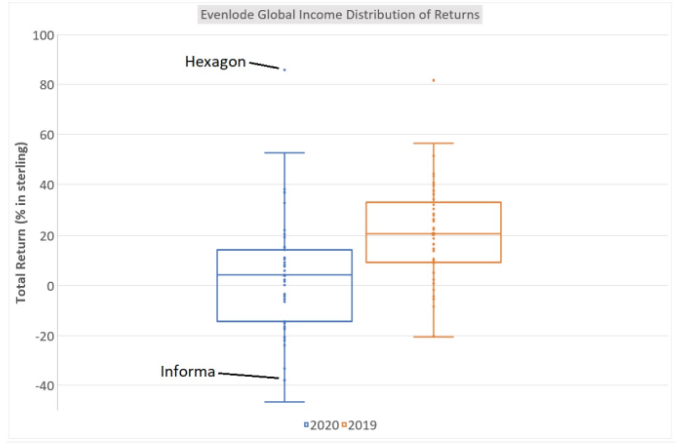
The spread of investment returns increased within the portfolio in 2020, not too dramatically[ii] but the chart shows that the increase in spread was downwards. The downwards movement in a Covid world is not so surprising with the benefit of hindsight as we look back over the last year and the turmoil it brought. That the spread did not expand more is also understandable as we look for businesses with certain qualities; no matter what the sector, the businesses within the portfolio are cash generative, have high returns on invested capital, good competitive positions and relatively low levels of leverage. We also naturally find such companies in a narrower range of sectors than those addressed by the broader market, so one would expect a narrower set of outcomes. We give more detail on sector performance below.
Even so, there were winners and losers. On the negative side, global events business Informa fell by the most as meeting face to face was outlawed and events got cancelled (we exited the company in the global income strategies during the year but retain a position in the UK-focussed Evenlode Income fund). Technology company Hexagon was the standout performer, one we initiated as a holding during the market downturn last March and which has rebounded very strongly since.
Examining the averages, the mean total return of a portfolio holding was 4%, and the median 4.3%, close to the fund’s overall performance for 2020 of 3.5%. So the portfolio has forged along the middle ground overall, some kind of happy medium, between extremes of return and without significant skewing from large positions moving one way or the other.
All this makes sense considering the Evenlode investment approach. Steady companies that churn out cash and grow a bit each year are our bread and butter. Some grow faster than others, and sometimes companies don’t grow either because they are exposed to the economic cycle or because they are seeing some other disruption, as Informa shows. We don’t get everything right of course, but extremes of performance are relatively rare; slow and steady is more the order of the day.
For this reason, we often say that the Evenlode strategy is likely to lag a strong market, and the global equity market has been strong particularly compared to the global economic performance. But as we’ve seen, it’s been strong in a concentrated sort of way over the recent past, and so our expected performance profile has been magnified a little.
This exposition has been mainly market-focussed. We are fundamentally business-first investors and prefer to discuss what’s happening at investee companies over what’s happening in the market. One useful thing the market does give us is a price though, which we can compare to the value we expect the portfolio to generate in free cash flows over the long term. This part of the equation stacks up very well for the portfolio at the current time, with a portfolio free cash flow yield of around 5% and the prospect for growth through time despite 2020 causing something of a dent for some companies thanks to coronavirus.
Fund performance - The headlines
The Evenlode Global Income fund’s performance for the last quarter and over the last year is summarised as follows:
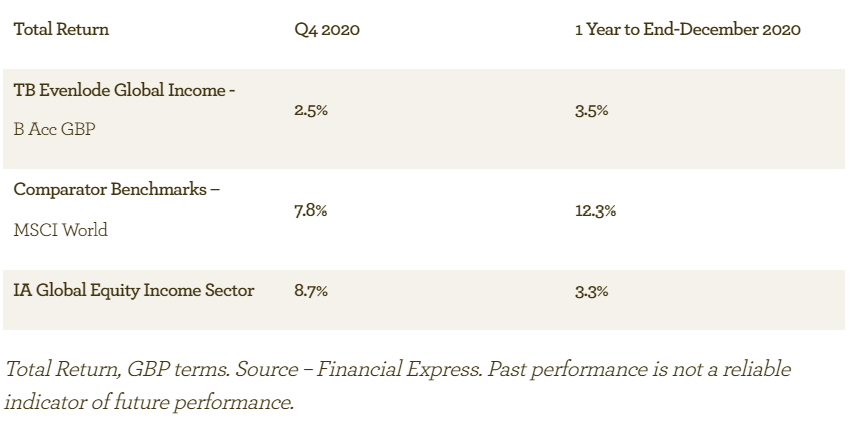
The final three months of the year saw a strong performance in the market, especially from economically sensitive companies and those directly affected by the effects of lockdown, due to the announcement of successful coronavirus vaccine trials. Whilst the fund has some exposure to such companies, these were offset by some of the fund’s larger positions performing weakly.
Which companies contributed in the quarter?
The table below shows the top five and bottom five contributors to total return of the fund:
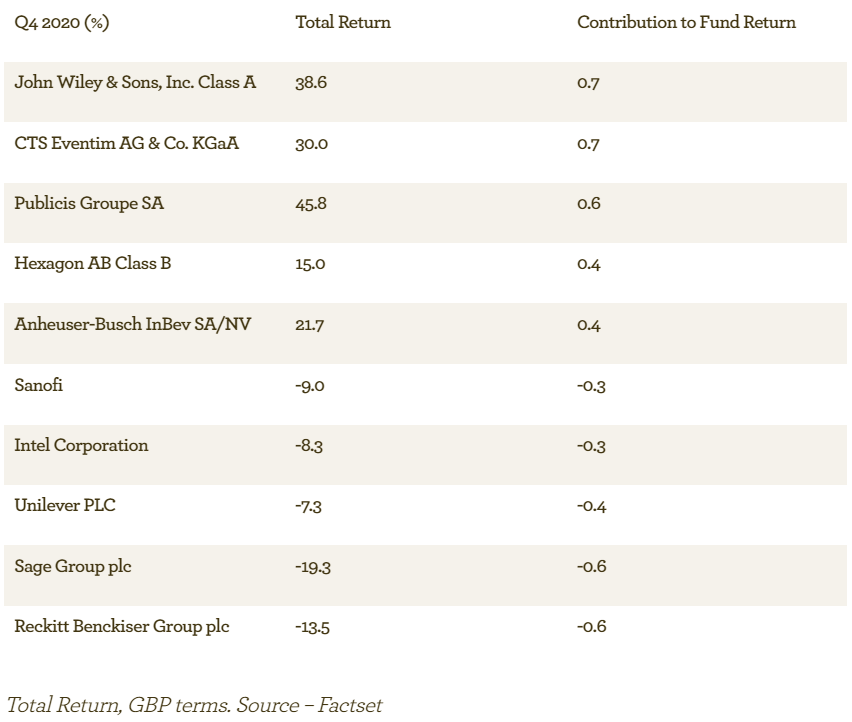
Publisher & education services provider John Wiley rose on strong results in both of its areas of operation, with open access journals growing and supportive education enrolment trends. Event ticketing company CTS Eventim saw positive sentiment as the market looked forward to returning to gigs and rubbing shoulders with vaccinated music fans. Advertising agency Publicis had better-than-expected results and was a beneficiary of the positivity towards more cyclical companies.
Negatively, consumer goods companies that had proven resilient through the initial downturn were out of favour. This dynamic particularly affected those with health and hygiene exposure like Reckitt Benckiser (the opposite of the CTS Eventim effect) and to a lesser extent Unilever. Sage Group posted decent results in the quarter but announced a programme of investment in product and sales that means near term profitability will be depressed. We believe this is sensible for the long run success of the business however.
Sector view
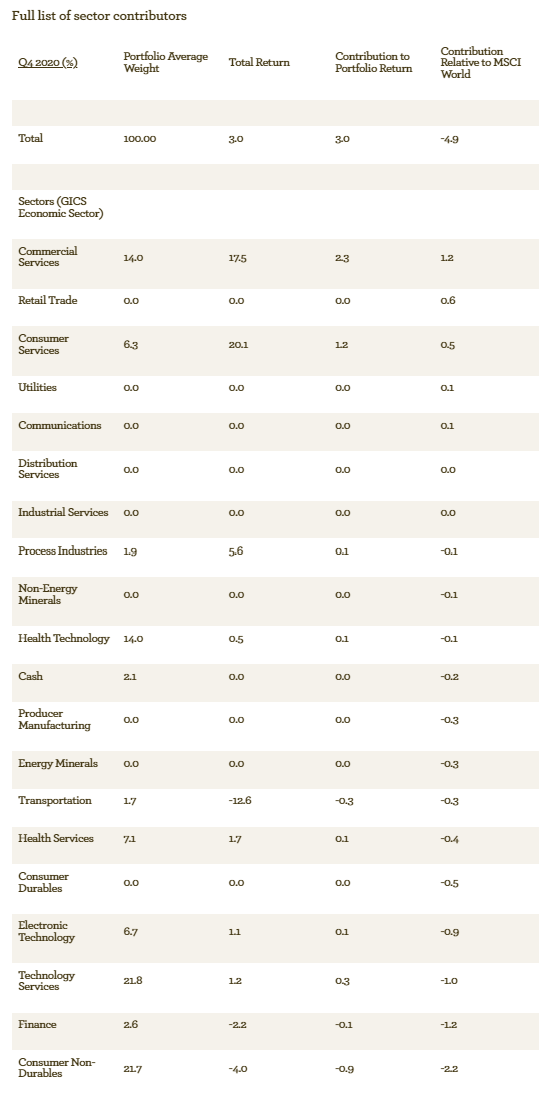
There are many ways to look at the performance of sectors within the portfolio. At its most basic we can look at the contribution of a sector to the overall performance of the portfolio, but we can also look at the performance against the fund’s benchmark to get an insight into what’s driving relative performance. Both are summarised in the table below which extracts sectors of interest and is ordered by the relative impact on returns compared to the MSCI World benchmark. A full table with sub-sector breakdowns can be found in the note at the end of this report.
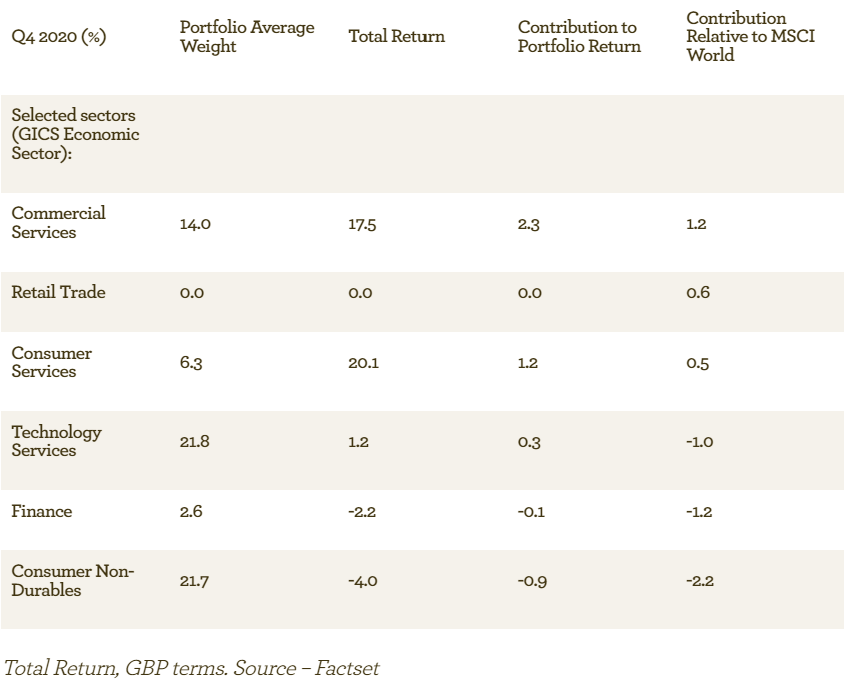
On a sector basis, returns relative to the benchmark were very much driven by asset allocation, with the overweights in Services performing well and Retail performing weakly in the market, an area to which the fund has no exposure. Negatively, consumer goods companies were weak, a sector to which the fund has a large weighting. The fund’s technology holdings performed well in absolute terms but lagged the market, and the sector also lagged the market itself.
The reversal of short-term sector trends further demonstrates the fickle nature of the market. Predicting these movements is a difficult task, as demonstrated by the further sector shifts observed in early 2021. As we have often discussed, we prefer to focus on the long term returns of the companies that we invest in and seek to take advantage of good buying opportunities offered by price fluctuations.
Looking ahead
Thanks to the extraordinary events of 2020, as we start 2021 there is even more of a draw towards the crystal ball than usual. We all hope that, with the help of the miracle of medical science that is vaccination, the coronavirus pandemic will start to subside, not just for the sake of those individuals whose life might be cut short by infection but for those whose jobs, finances and lives are being upturned by the public health measures necessary to combat the disease.
We remain grateful for the efforts of scientists, healthcare professionals, teachers and others on the ‘front line’ of the pandemic, helping directly to battle it and also indirectly to keep as many of us in work and education as is possible.
We will continue with the job of investing your and your clients’ savings here at Evenlode Investment. The team has been working largely remotely for over ten months now, diligently analysing companies’ business fundamentals and other important aspects like their environmental ambitions and governance arrangements.
We have been enabled by another scientific miracle – distributed computing – and have been pleased that we have been able to see many of you remotely over this time. It is not a replacement for seeing you in person though, and while it will take time and patience we look forward to the time when we can. In the meantime, we encourage you to get in touch with us by any of the means currently possible and we’ll be very happy to answer any questions you might have.
Ben Peters, Chris Elliott and the Evenlode team
12 January 2021
Please note, these views represent the opinions of the Evenlode team as of 12 January 2021 and do not constitute investment advice.
Past performance is not a reliable indicator of future results. The value of investments can go down as well as up, and investors may not get back the money they invested.
[i] In this diagram the boxes show the interquartile range and the whiskers 1.5 times the interquartile range from the median.
[ii] The standard deviation of portfolio returns increased from 19.4% to 23.3% to put a number on the change in spread of returns.
