The commentary below applies to the Evenlode Global Income strategy. Five-year performance data and attribution analysis is only provided for TB Evenlode Global Income as Evenlode Global Dividend only launched in May 2018. All market data is from FactSet and FE Analytics.
The Evenlode Global Income strategy marked its fifth anniversary on 20 November. As with most anniversaries we enjoyed the moment and wondered where the time has gone. To say that we have interested, supportive and loyal clients is an understatement – your support has been nothing short of incredible, is what spurs us on each day, and is not something that we take for granted. This is especially so given the global happenings over the last five years that have tested the nerve of the most patient of investors. The coronavirus pandemic and Putin’s invasion of Ukraine have had, and continue to have, profound influences on the global economy, the companies that operate in it, and the financial markets that intermediate it. These specific events sit in a context of shifting global sands, whether geopolitical, technological or cultural.
Within the investment industry things have changed. The rise of the ESG paradigm has been a phenomenon over the time since Evenlode Investment began life in 2009 and has accelerated in the last five years. We view this as mainly a good thing, with matters of sustainability much further up everyone’s agenda. But there is rightly now increased scrutiny of the claims of corporates and investors to have ‘gone green’. We have developed our capabilities in this important area, and if you haven’t already, we recommend a visit to the Stewardship section of our website for more detail about our approach. Our investment and operations teams have grown as our analysis and our clients’ requirements have broadened and deepened. We want to continuously improve what we are doing whether analysing companies, making portfolio decisions, or communicating with our clients.
Amid all this change there are some things that are constants. The principles under which we invest, seeking market leading, high return on capital businesses and investing at sensible prices, remain unchanged. We remain absolutely focused on the long-term prospects for companies, our clients and our own business. And we remain willing to change things when there is a good reason to. The pandemic saw elevated levels of portfolio turnover, mainly in response to the large changes in market valuations that we saw, but also as we re-assessed the prospects for some companies.
With the five-year scores in, we now have what we consider to be the minimum time-period over which to critically assess the performance of the portfolio. In the remainder of this view, we’ll pick out some of the high- and low-lights.
Performance – The numbers
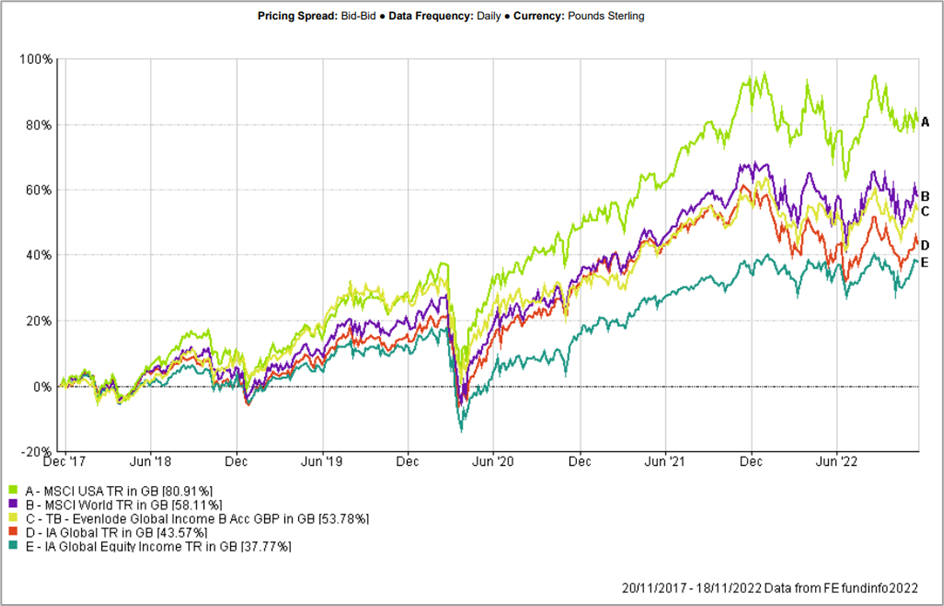
In terms of the raw numbers, the chart below shows the first five years of TB Evenlode Global Income against a few different benchmarks in sterling terms. Compared to the fund’s comparator benchmark, the MSCI World Index, we were a little behind with a total return of +53.8% against the index’s +58.1% (at the time of writing the gap has narrowed a little).

The largest country component of the MSCI World Index is of course the US, which accounts for about 69% of its market capitalisation (Source: MSCI, November 2022). As measured by the MSCI USA Index, the world’s largest equity market has soared, up by +80.9%. This has famously been driven by technology companies, which have experienced some volatility of late.
Against other similar funds TB Evenlode Global Income is ahead over the five years, although that’s been a game of two halves. Comparing performance to other strategies in the Investment Association’s Global Equity Income sector, the fund outperformed in the first half of its life but has underperformed more recently, particularly this year as energy companies have rallied with the rise in gas and oil prices.
Comparing to the Investment Association’s Global sector, the Evenlode Global Income strategy is also ahead. The outperformance occurred more recently as technology companies fell, so is the inverse of the comparison to income-based strategies as we’ve gone through time.
Something we say in meetings with prospective clients is that we would like to outperform as active equity managers, but we want to do so whilst taking less business risk in the portfolio. We manage business risks rather than market measures of ‘risk’ such as beta or volatility but suspect that managing the former has beneficial impact on the latter over a suitable period.
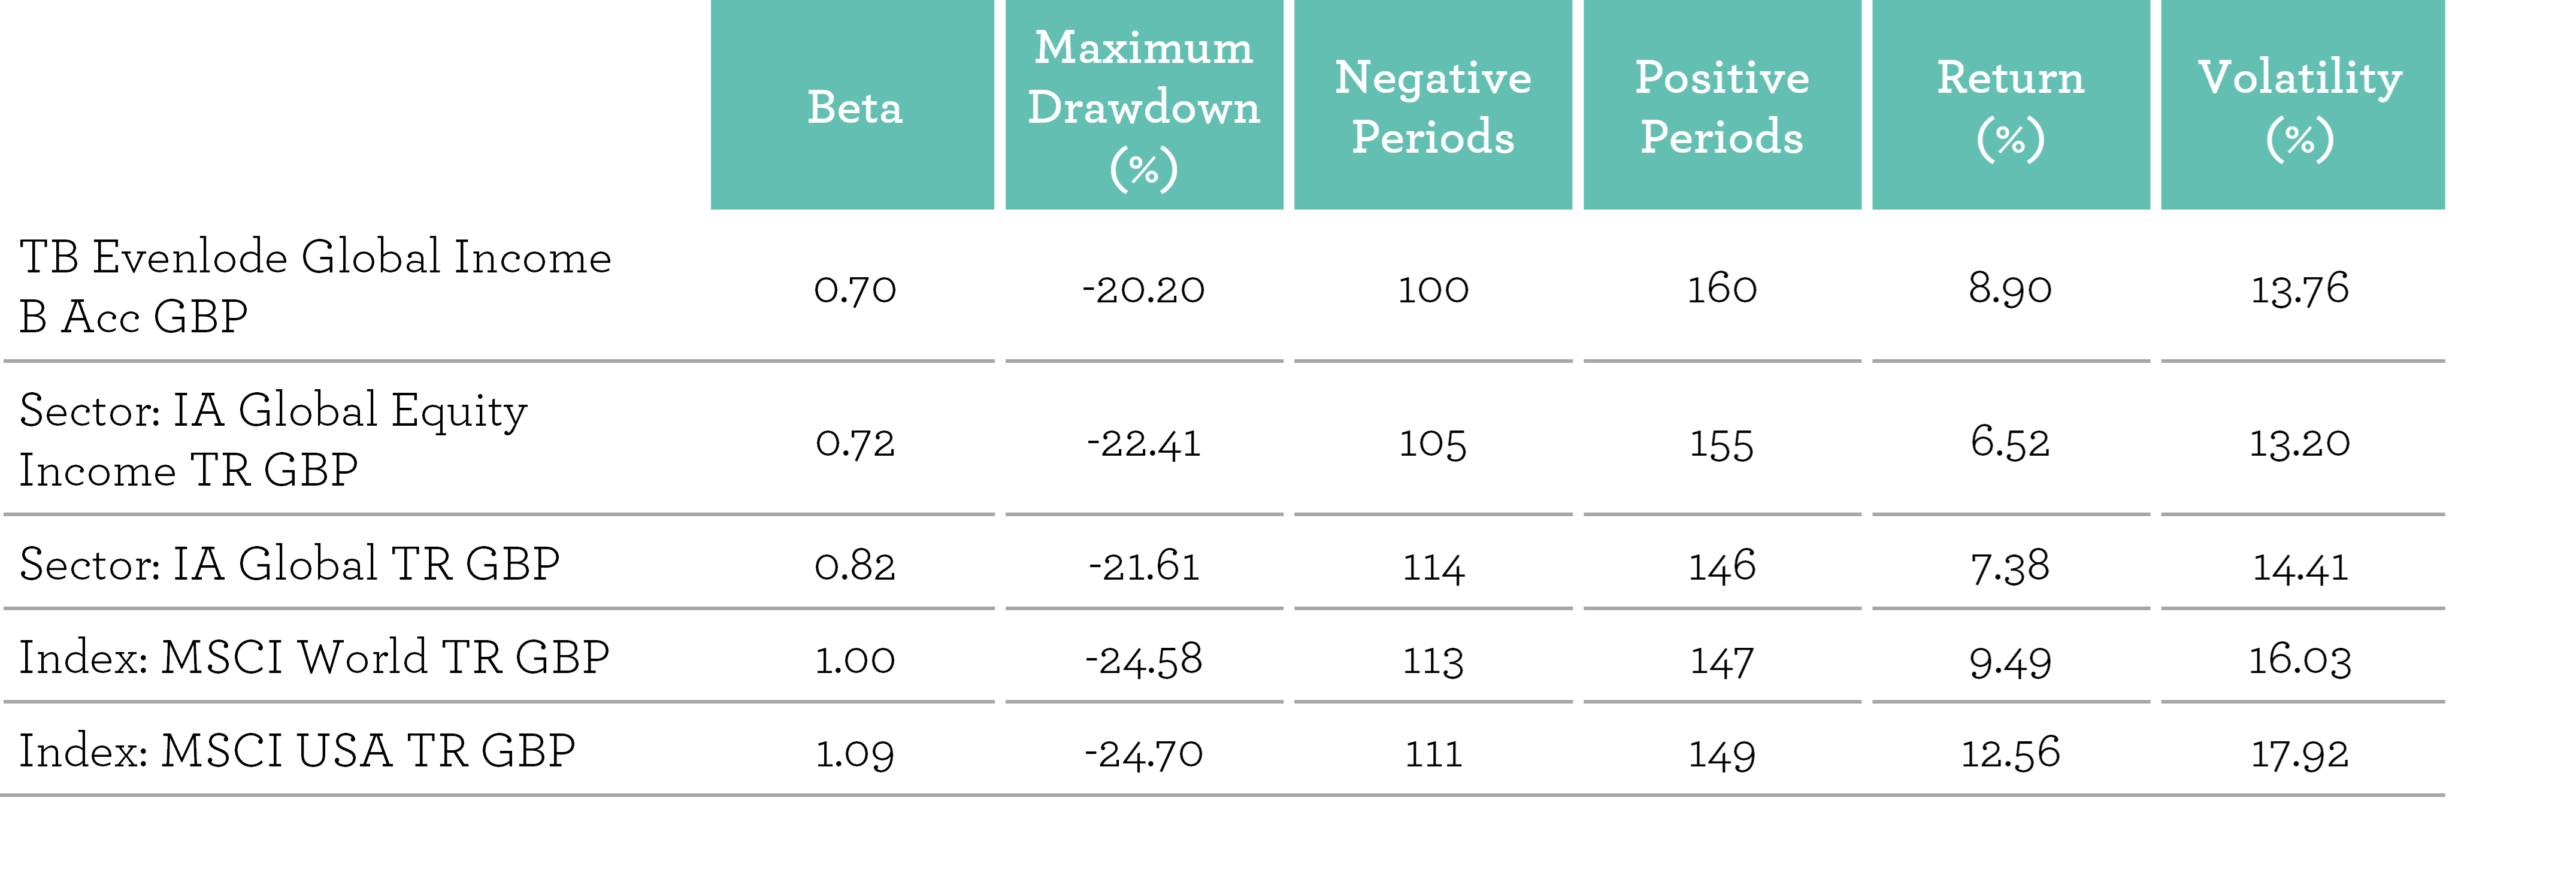
The table below shows a few market risk measures for the fund compared to the benchmarks already discussed (Source: FE Analytics, 20 November 2017 to 20 November 2022, annualised figures using weekly returns, benchmark MSCI World Index).

The fund has the lowest beta (compared to the MSCI World Index), lowest maximum drawdown and lowest number of negative periods compared to the other measures listed. It also has a lower volatility than the market indices, although volatility is slightly higher than the IA Global Equity Income sector of funds.
These differences aren’t huge and do change through time depending on the market environment. However, that the stats are on the right side of our comparator benchmark indicates that risk management has translated into the sort of performance profile we would expect to date.
Taking the return and the risk pieces together we’re feeling ok about the execution of our philosophy and strategy to date. But we can always do better and there is always something to learn, and it goes without saying that we haven’t got everything right. Next, we’ll look at some of the detail under the surface of these headline results.
Performance - Portfolio dissection
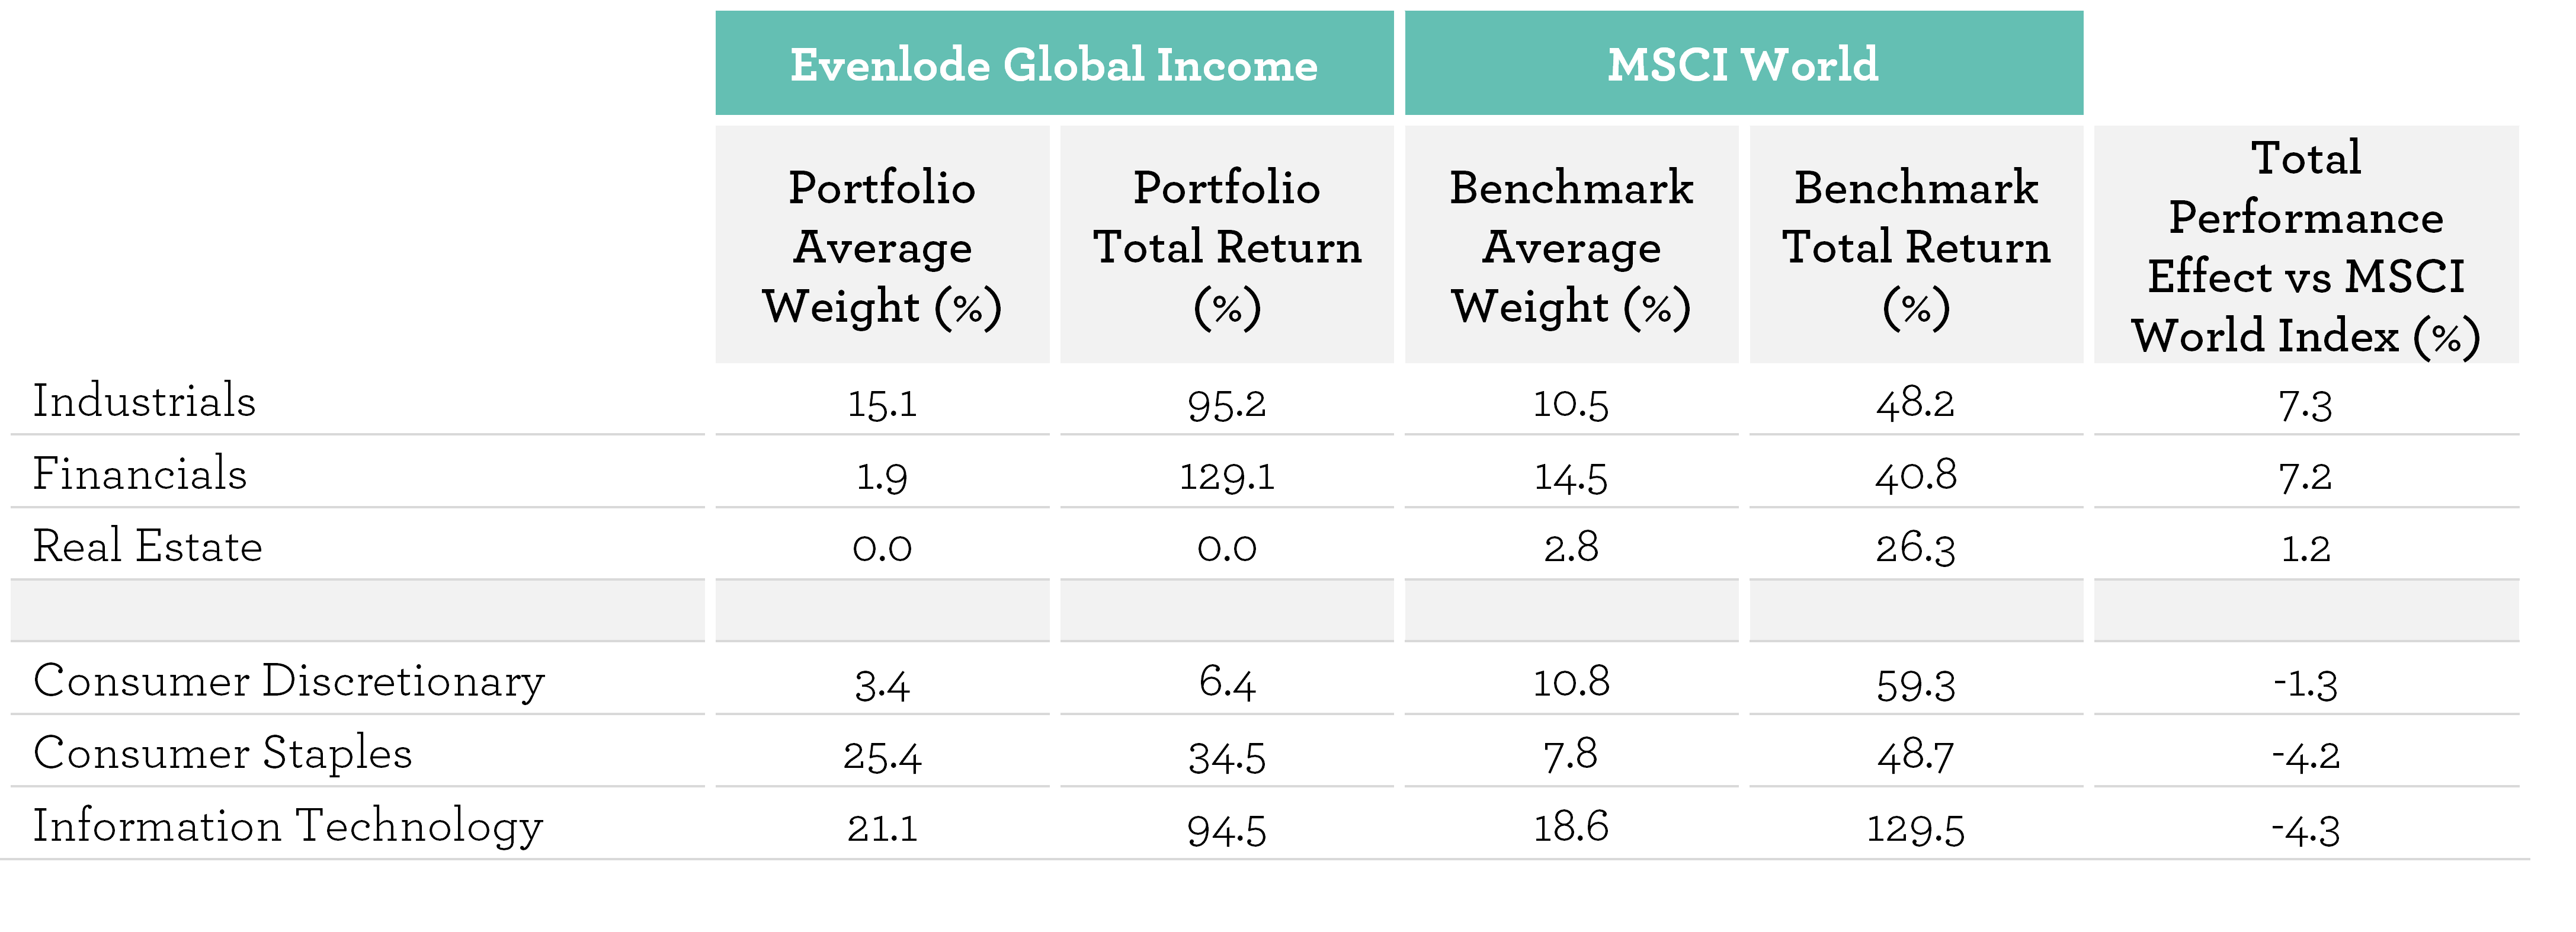
As we select companies with specific characteristics, it follows that the shape of the portfolio is quite different to the market as a whole. Some of these differences are seen in the table below, which shows the performance of different sectors found in the portfolio. Specifically, we have highlighted the top and bottom three sector contributors when compared to the benchmark, the MSCI World Index (Source: FactSet, 20 November 2017 to 18 November 2022).

At the top is the unhelpfully-named ‘Industrials’ sector (we have followed the GICS classification standard for industries). Within this sector are capital goods companies that manufacture stuff, or make equipment to help others to manufacture stuff. The fund has little exposure to these sorts of companies, as they tend to generate low returns on capital. Also, within the Industrials sector are commercial and professional services companies, and this is where we find many more businesses that fit our process. The top contributor to fund performance over its first five years is Wolters Kluwer, a Dutch business-to-business information, data and software company. We often use Wolters Kluwer as an example of what we are looking for in a company, and it’s pleasing to see it top the charts as well. Other companies in this sub-sector have performed well also like RELX, another data and analytics company, and SGS, a testing, inspection, and certification service provider. However, also lurking in the sector is one of our most negative contributors in the form of recruitment company Adecco, which we exited earlier this year after its balance sheet weakened following an acquisition.
Our Financials exposure has been low but performed very well thanks largely to financial exchange operator Euronext. We sold out of the company in September 2020 as the share price had performed so well that the valuation appeal had diminished, and this turned out to be a good move as the shares subsequently underperformed. The company is currently on our ‘subs bench’, as it has taken on debt to fund acquisitions. It may make it back into our investable universe if it reduces its debt burden.
At the other end of contributors relative to our benchmark is the Information Technology sector. With this sector returning +94.5% for the fund it has clearly been a benefit to our absolute performance number. However, with the broader sector returning +129.5% within the benchmark, this has been a drag to relative performance. We are now currently underweight in technology companies as their valuations became stretched through the course of the pandemic, although we have been adding to companies like Microsoft and Accenture as they have underperformed this year.
The Consumer Staples sector contains household brand makers, and whilst positive in absolute terms underperformed both the market and other similar companies within the market. This is primarily down to holding two companies that performed poorly. Global brewing giant AB Inbev was hit by the pandemic but did itself no favours by having too much debt following the huge acquisition of SABMilller some years ago. We should have put greater weight on the risks posed by its weak balance sheet; eventually we did and sold the fund’s position. German conglomerate Henkel might be equally situated in the Industrials sector, as half of the business (the better half, as it turned out) is a high-tech industrial adhesives manufacturer. The other part is a consumer goods business with brands like Schwarzkopf and Pritt-Stick, which has suffered from a lack of focus and scale in some of its sub-sectors. That said, there is enough to like in its portfolio and the company’s management have taken clear steps to address its issues, and we continue to hold a position. There have been bright spots in the Consumer Staples sector though with food and beverage companies Nestlé and PepsiCo contributing well, along with Procter & Gamble.
The IT and Consumer Staples sectors highlight an oddity about investing, particularly when comparing performance to a benchmark – both a 95% and a 35% absolute return can be painted as disappointing! Examples like Henkel show that it’s sometimes not clear cut which sector a company should lie in, but in any case, we don’t construct the portfolio with reference to the benchmark. Rather, we build it company by company and manage portfolio-level factors like diversification by sector, sub-sector, and geography as well as managing risks like levels of debt. All the same, to understand differences in the performance profile it is helpful to dissect performance in absolute terms and relative to the market as we’ve done here.
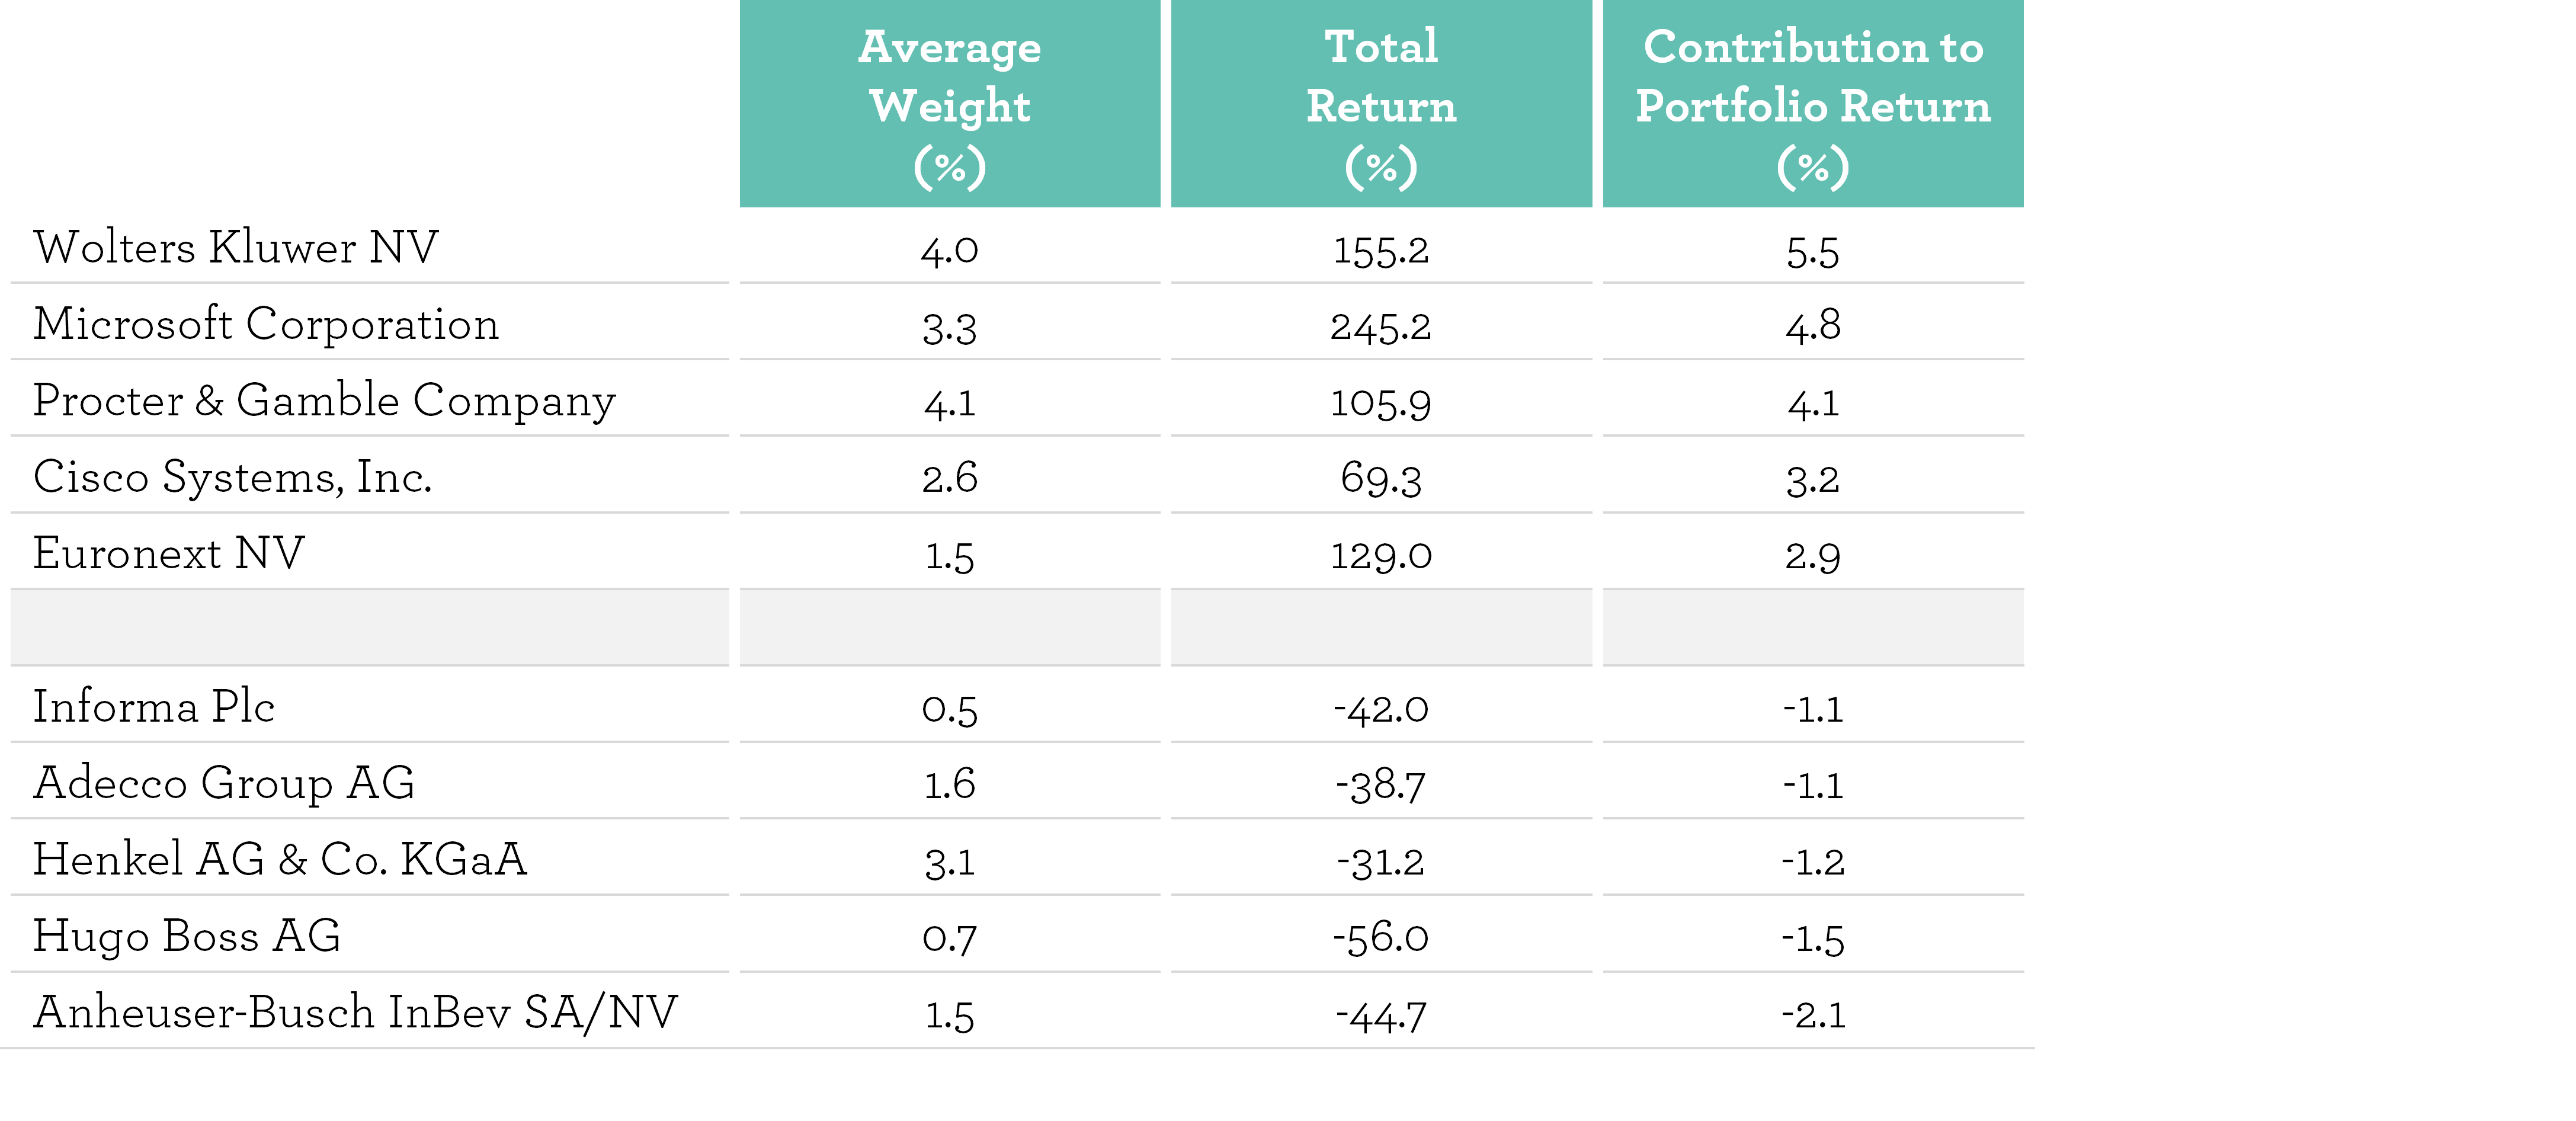
In absolute terms we can learn from our positive contributors and from the less successful investments. Here are the top five and bottom five contributors to the fund’s first five years (Source: FactSet):

Most of these we’ve already mentioned. To cover off the rest, networking equipment and software company Cisco is one of the technology cadre that have performed very acceptably but behind their IT sector counterparts. Informa is an information and business services company that includes the world’s largest events business, which was challenged during the pandemic. We sold the position to manage totality of pandemic-related risks in the portfolio, although the company remains a holding in the Evenlode Income fund. Finally Hugo Boss was affected by the closure of bricks-and-mortar stores during the pandemic, but we in fact sold the holding due to question marks around its long-term distribution strategy.
Is there anything to be learned from this somewhat disparate list of businesses and their varying fortunes? For those at the top of the list they have managed to churn out growth that has ranged from the solid to the quite extraordinary in the case of Microsoft. Euronext is an interesting case though as the stock has underperformed since we sold the position. Partly that may be valuation-related, but it is perhaps not a coincidence that the company has also taken on debt to fund acquisitions. At the bottom of the pile debt has been a feature for AB Inbev, Adecco and Informa. Leverage can be manageable, but AB Inbev in particular shows that it reduces the wiggle room for companies if things don’t quite go according to plan.
It is impossible to eliminate all risks of course, but we can manage them. Recognising through our analysis where there are risks at a company is ultimately reflected in our position sizing, and this has limited the impact of the negative contributors. With the benefit of hindsight, we shouldn’t have owned any of the fallers, but their impact was at least limited. The bottom five contributed -7% from the fund’s performance over five years; the top five +21%. This is in the context of broadly rising prices so returns are skewed upward, but overall position sizing has helped cushion some of the blows from our greatest misses.
Looking forward to the next five years
A nice thing has happened over the last five years. We have actively sought out new companies that fit our criteria for our investable universe and have been willing to move on from ones where we’ve re-assessed and changed our minds. As a result, we believe that the quality of our investable universe has got better, the bar has been raised. Meanwhile the recent downturn in equity markets has left valuations looking reasonably comfortable. Improved quality and value feel like a good place to be looking forward to the long-term future from, but there are obviously many economic risks and geopolitical factors that will need to be navigated by our portfolio companies. The fund’s history so far suggests that overall they are able to meet such challenges.
As we look back, and to the future, we give our thanks to our business partners, our service providers and our clients. It is a privilege to manage your capital, and we hope to do so for as long as you need us to. We’ve given a summary of the drivers of the first five years of the fund’s performance here but are willing to go into more detail with any interested clients so please do get in touch if that is the case.
Wishing you a merry Christmas and a prosperous 2023 and beyond.
Ben, Chris, Bethan, Rob and the Evenlode team
14 December 2022
Please note, these views represent the opinions of the Evenlode Team as of 14 December 2022 and do not constitute investment advice.
Where opinions are expressed they are based on current market conditions, they may differ from those of other investment professionals and are subject to change without notice. This document is not intended as a recommendation to invest in any particular asset class, security or strategy. The information provided is for illustrative purposes only and should not be relied upon as a recommendation to buy or sell securities.
For full information on fund risks and costs and charges, please refer to the Key Investor Information Documents, Annual & Interim Reports and the Prospectus, which are available on the Evenlode Investment Management website (https://evenlodeinvestment.com). Recent performance information is also shown on factsheets, also available on the website.
Past performance is not a guide to future returns. The value of investments and any income will fluctuate (this may partly be the result of exchange rate fluctuations) and investors may not get back the full amount invested. Fund performance figures are shown inclusive of reinvested income and net of the ongoing charges and portfolio transaction costs unless otherwise stated. The figures do not reflect any entry charge paid by individual investors.
Current forecasts provided for transparency purposes, are subject to change and are not guaranteed.
Source: Evenlode Investment Management Limited. Evenlode Investment Management Limited is authorised and regulated by the Financial Conduct Authority, No. 767844.